Through Process Analysis, once you identify waste on the shop floor, the next step is to analyze precisely where and why it occurs. To achieve this, Process Analysis is essential, and LOB (Line of Balance) is the technique used to balance the line based on that analyzed data.
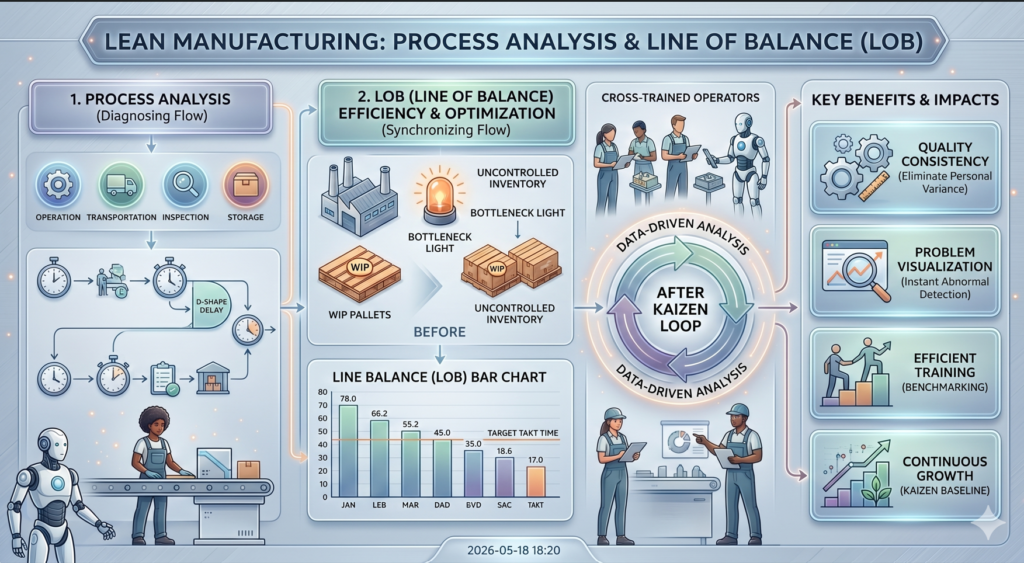
1. Process Analysis: Diagnosing the Pulse of the Shop Floor
Process Analysis is a technique that maps and analyzes the entire journey from raw materials to the finished product using five standard symbols: Operation, Transportation, Inspection, Delay, and Storage.
- Objective: To shorten lead times by minimizing non-value-added processes (Transportation, Delay, Storage) that do not generate value.
- Core Focus: It provides visual clarity on where ‘Transportation’, ‘Waiting’, and ‘Inherent Processing Waste’—three of the 7 wastes of Lean—are hidden.
2. LOB (Line of Balance): The Art of Synchronizing Line Rhythm
LOB is a line-balancing technique that minimizes cycle time variations between processes, ensuring a smooth, continuous, and uninterrupted flow across the production line.
Why LOB Matters:
As discussed previously, one of the biggest dangers of excess inventory is that it hides line imbalances. Through LOB analysis, you can uncover the true bottleneck processes hidden beneath the surface of inventory.
- Synchronized Production: It eliminates waiting waste by matching the cycle time of each process as closely as possible to the Takt Time.
- Eliminating Unevenness (Mura): It redistributes tasks so that no single operator is overloaded (Waste of Motion) while others sit idle with nothing to do (Waste of Waiting).
3. Calculating LOB Efficiency with Process Analysis
LOB efficiency is calculated by dividing the sum of all process times by the product of the longest process time (bottleneck) multiplied by the number of operators.
- Improving Line Efficiency: If efficiency is low, the bottleneck time must be shortened by resequencing tasks, upgrading equipment (TPM), or implementing error-proofing devices (Poka-Yoke).
- Flexible Workforce Allocation: Through Heijunka (Production Leveling), a flexible line operation utilizing multi-skilled workers is required to maintain LOB efficiency even when production volumes fluctuate.
[Case Study] Improving Line of Balance (LOB) Efficiency
LOB Efficiency Analysis: Uncovering the 42% Hidden Loss
The current production line consists of 5 sequential processes arranged linearly. However, due to an imbalance in cycle times between stages, the LOB efficiency is stuck at 58%.
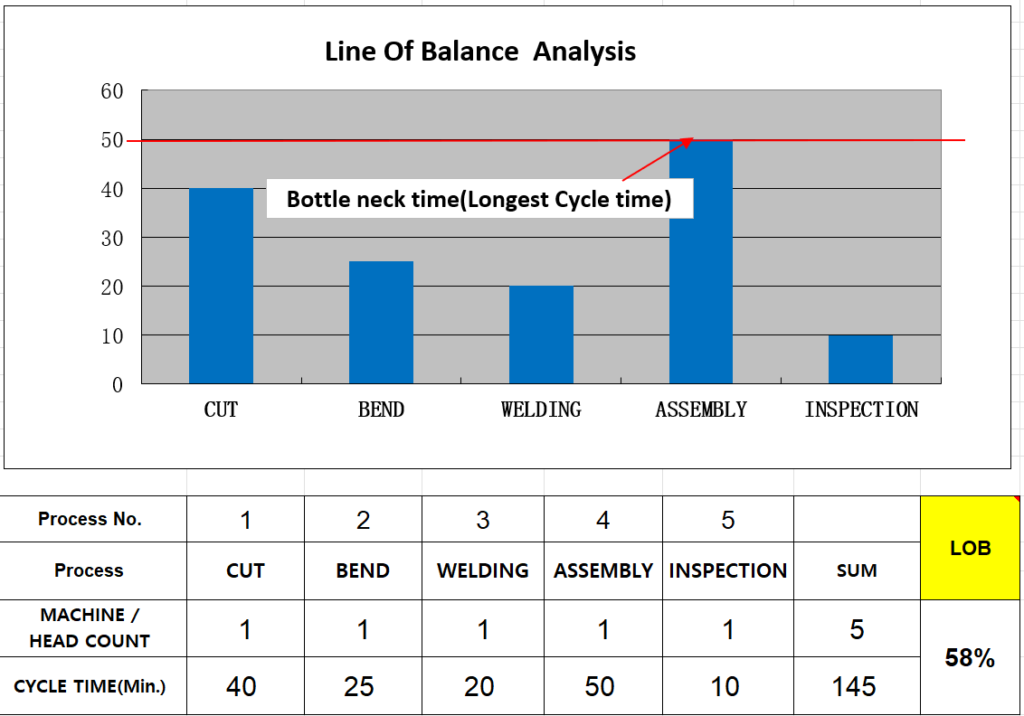
This indicates that approximately 42% of time-based loss is occurring across the line. When converted into “waiting time” per process, significant losses occur in all stages except for the assembly process, which is the clear bottleneck (50 mins):
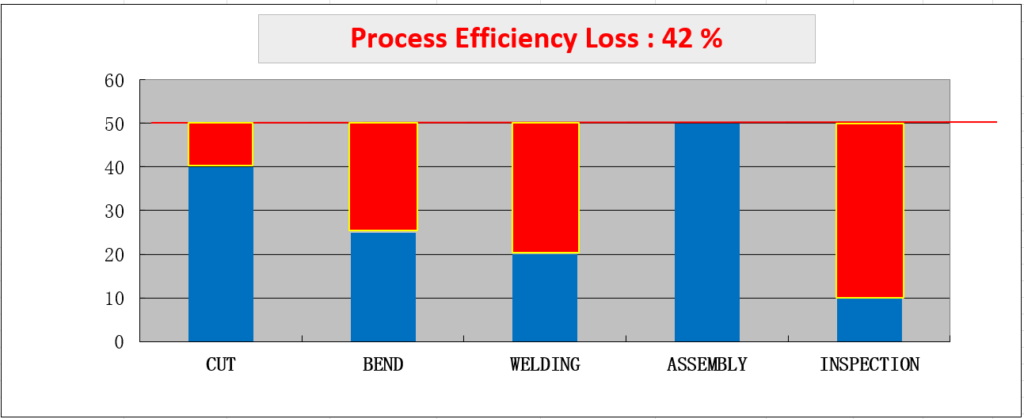
- Cutting Process: 10 mins of waiting
- Bending Process: 25 mins of waiting
- Welding Process: 30 mins of waiting
- Inspection Process: 40 mins of waiting
Consequently, all other processes are frequently forced to stop to match the pace of the Assembly stage. Minimizing this idle time is the absolute key to driving productivity. How can we improve the line balance efficiency of this manufacturing line?
Countermeasure 1: The Theoretical Ideal (Process Redesign)
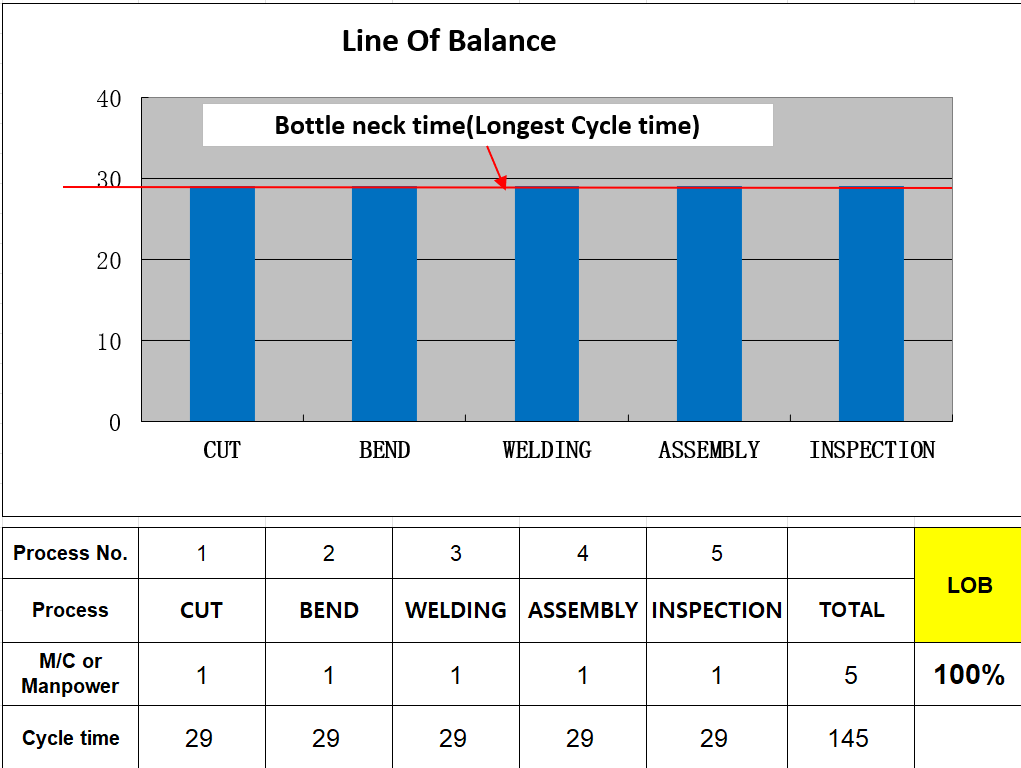
The ideal target for maximum line efficiency is to distribute the total cycle time of 145 minutes evenly among the 5 operators. If every process is perfectly balanced at an average of 29 minutes, the LOB efficiency hits 100%, completely eliminating time losses from waiting and idling. The chart below illustrates this ideal concept.
In industrial practice, manufacturing leaders often set their target LOB efficiency around 85%. Here is the reasoning behind this industry standard:
1. Why 85% Instead of 100%?
While 100% is theoretically perfect, achieving it in a real-world environment is nearly impossible—and can even be risky—due to several variables:
- Operator Skill Gaps: Human operators are not machines; they do not move at an identical pace.
- Fatigue and Allowance Time: Line design must account for human fatigue and physiological needs through proper time allowances.
- Equipment Downtime & Material Fluctuation: In a 100% tightly balanced line, a minor machine micro-stop or a slight material delivery delay will instantly halt the entire line.
- Flexibility Buffer: An 85% target acts as a “buffer zone,” allowing the line to absorb minor, unexpected disruptions internally.
2. LOB Targets by Industry Typology
The benchmark for excellence varies depending on the nature of the manufacturing environment:
| Industry Type | Target LOB Level | Remarks |
| Automated Lines | 90% – 95%+ | Equipment-driven processes with minimal variability. |
| General Assembly Lines | Around 85% | High human labor component; 85% is considered world-class. |
| High-Mix Low-Volume (HMLV) | 75% – 80% | Balancing is challenging due to frequent changeovers. |
Countermeasure 2: Practical Optimization (Process Integration)
In reality, adjusting every machine-dependent process to a uniform 29 minutes is often impractical. Therefore, the actual field improvement was implemented as follows:
[The Core of Labor Efficiency: Process Integration via Multi-Skilled Workers]
The line was streamlined from 5 operators to 3 operators through workforce capability upgrades and process redesign. Specifically, ‘Cutting’ and ‘Inspection’ were integrated into a single station (50 mins), and ‘Bending’ and ‘Welding’ were combined (45 mins) to maximize per-capita productivity.
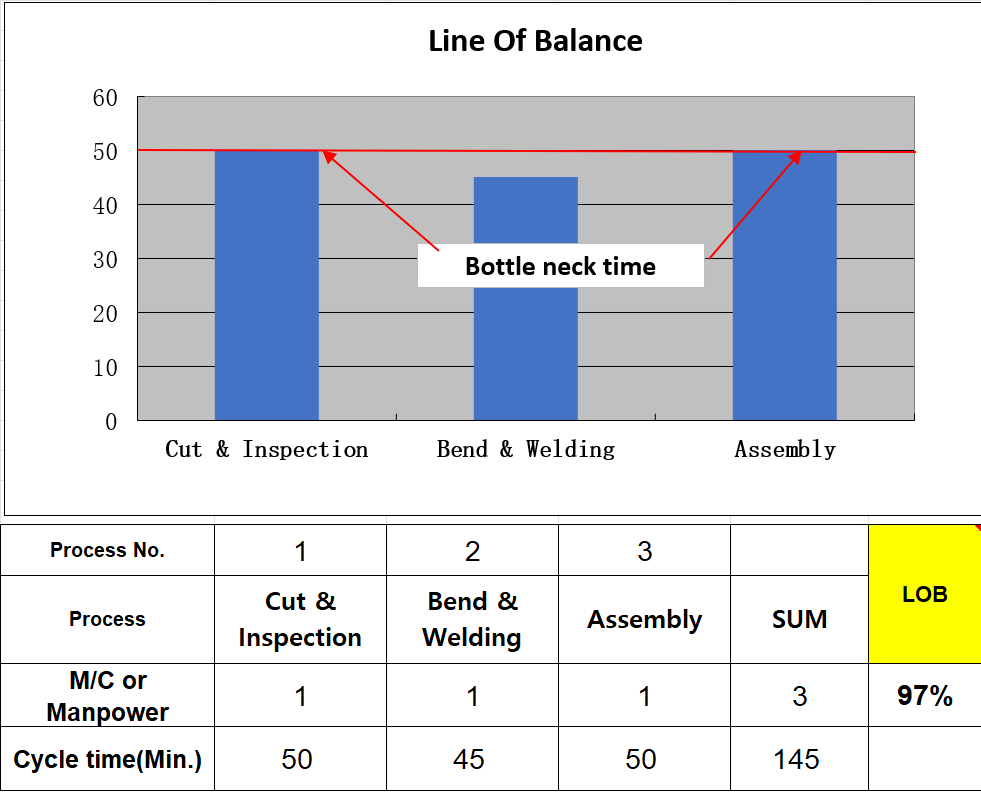
The deciding factor behind this successful transformation was the development of multi-skilled workers (Cross-training). This outcome was only possible because we built a flexible workforce where a cutting operator could seamlessly handle inspection, and a bending operator could execute welding tasks. While shop floors naturally tend to maintain legacy headcount out of habit, process integration via multi-skilling is an absolute necessity to secure manufacturing competitiveness.
Conclusion: Process Optimization Shapes the Future of Manufacturing Innovation
Process Analysis and LOB are far more than mere math tools for efficiency; they mark the beginning of data-driven management that builds true operational “trust.” Many plants stock up on excess inventory out of anxiety over short lead times or machine breakdowns. However, this safety net ultimately buries all underlying operational issues beneath the surface, denying the plant the opportunity to improve.
- The Courage to Drain the ‘Sea of Inventory’: Facing non-value-added steps via Process Analysis and quantifying imbalances through LOB can be painful because it exposes the raw, unpolished realities of the shop floor. Yet, it is only when you drain this “sea of inventory” that you can finally see and blast away the true bedrock of bottlenecks.
- Realizing QDCP: A meticulously designed LOB suppresses overproduction to cut Costs, shrinks lead times to sharpen Delivery competitiveness, and stabilizes operator rhythm to simultaneously elevate Quality and Productivity.
- Sustaining an Autonomous Shop Floor: Visualized process data (Visual Management) provides clear goals and standards not just for management, but for the operators themselves. This serves as the foundational bedrock upon which a proactive, self-improving Kaizen culture takes root.
“Ultimately, management is the art of managing flow.”
The sequential journey of upgrading your operational blood vessels through Process Analysis and synchronizing your heartbeat via Takt Time is the core of lean transformation. Applying Process Analysis effectively to the shop floor will serve as the most definitive roadmap for manufacturing leaders struggling to maximize productivity.
💡 Recommended Reads from This Blog: Standardized Work
Discover more from mfginsights.net
Subscribe to get the latest posts sent to your email.