“Elliott Wave Theory is a powerful tool for predicting stock price movements.”
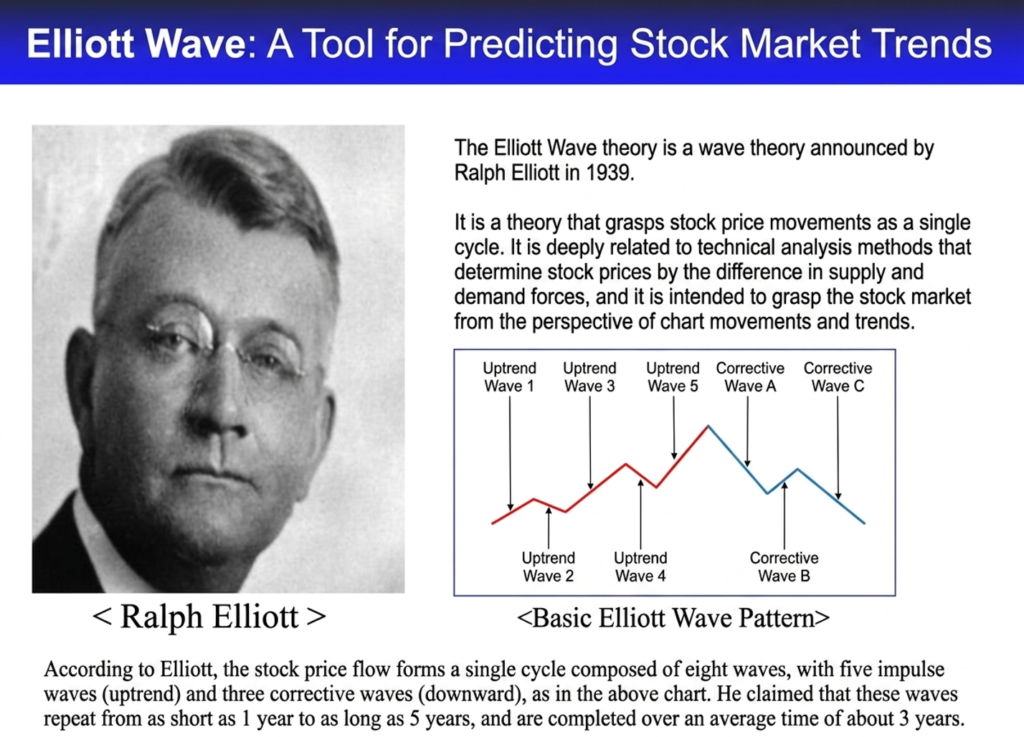
I have established four strict principles that I always follow when investing in stocks. I developed these rules because failing to adhere to them led to the painful experience of losing hard-earned capital. I hope these principles help you achieve consistent and successful investments.
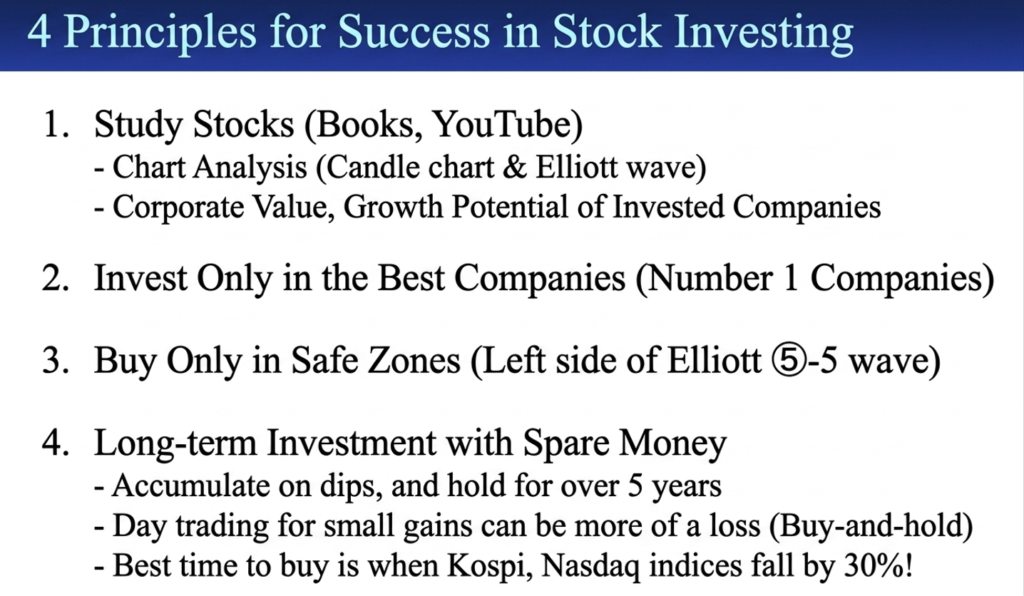
1. Definition of Elliott Wave Theory
Developed by Ralph Nelson Elliott, this theory posits that financial markets do not move randomly. Instead, they follow specific, repetitive patterns (waves) that reflect the collective psychology of market participants.
1) The Basic Structure : The 5+3 Pattern
Stock prices complete a full cycle through a combination of five Impulse Waves (advancing waves) and three Corrective Waves (retracing waves). In this framework, the waves moving in the direction of the main trend are known as Impulse Waves, while those moving against it are termed Corrective Waves.
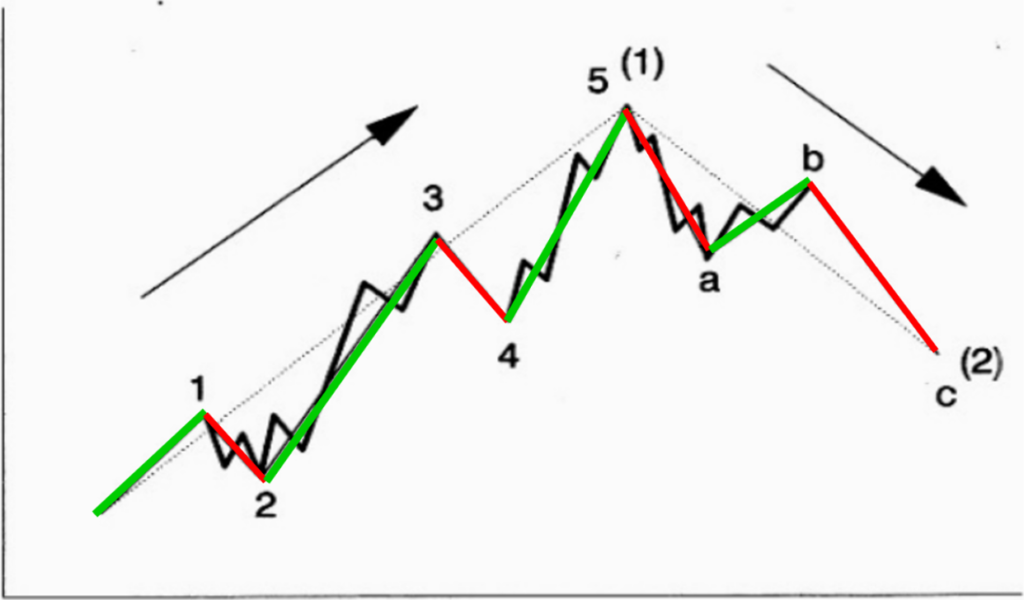
- Impulse Waves (Waves 1–5): These waves move in the direction of the market’s main upward trend. Waves 1, 3, and 5 (represented by green lines) are the primary advancing moves, while Waves 2 and 4 (represented by red lines) show temporary retracements.
- 2. Corrective Waves (Waves a-b-c): This is the downward phase that appears after the upward trend has concluded. Waves ‘a’ and ‘c’ (red lines) represent the decline, while wave ‘b’ (green line) shows a temporary upward bounce within the correction.
2) The Three Unbreakable Rules of Elliott Wave
For an Elliott Wave count to be valid, these three rules must be strictly followed. If any of these are violated, the wave count must be re-evaluated:
- Rule 1: Wave 2 can never retrace more than 100% of Wave 1.
- Rule 2: Wave 3 can never be the shortest of the three impulse waves (Waves 1, 3, and 5). Typically, Wave 3 is the longest and most powerful.
- Rule 3: Wave 4 can never enter the price territory of Wave 1 (they must not overlap).
3) Relationship with Fibonacci Ratios
Elliott Wave Theory is deeply integrated with Fibonacci Retracement ratios (such as 0.382 and 0.618). For instance, Wave 2 often retraces approximately 61.8% of Wave 1. Understanding these ratios allows traders to forecast potential reversal points and future price targets with greater precision.
Elliott Wave Case Study: Samsung Electronics (Pref)
The stock chart below illustrates a real-world example (Daily Chart) of a trend reversal following the global market crash triggered by the sudden COVID-19 pandemic in January 2020.
After peaking at KRW 62,800 in January 2020, the stock price experienced a sharp 40% plunge, bottoming out at KRW 34,900 in March, before initiating a strong rebound.
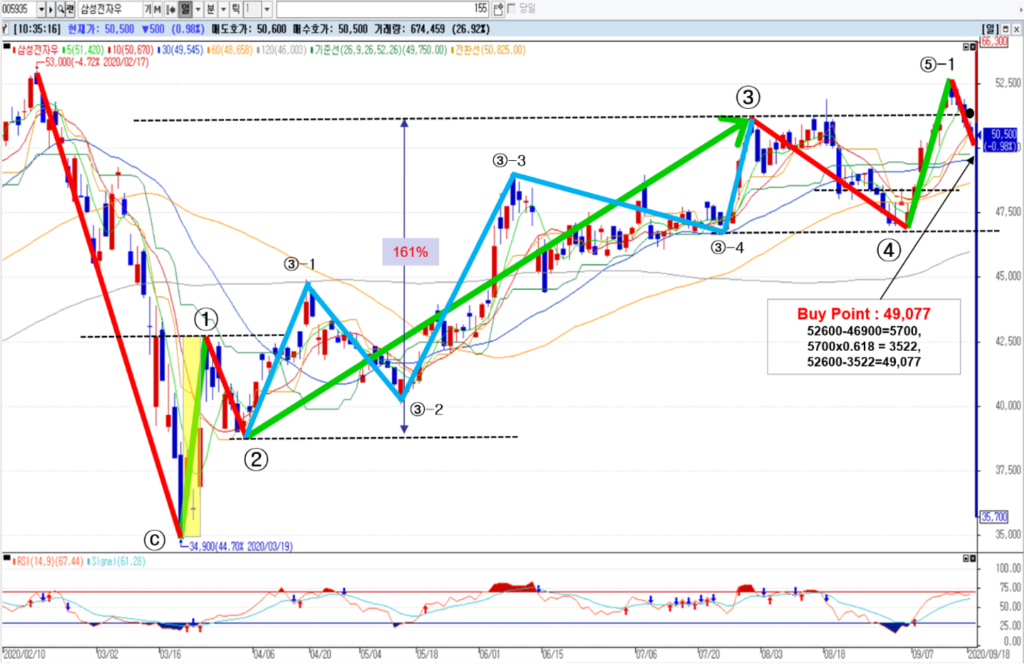
The downward Corrective Wave C concluded at KRW 34,900 in mid-March 2020, followed by the initiation of a new upward impulse wave. By January 2021, the 5th upward wave reached its peak at KRW 96,800. This represents a significant rebound of over 50% within just one year, even when measured against the previous high of KRW 62,800.
2. Wave 1 : the Conditions for a ‘Real’ Rebound
Many investors either miss the start of an upward trend—Wave 1—or fall for a ‘fake’ bounce, leading to significant losses. To help you set the right foundation for your technical analysis, I’ve summarized the core principles for identifying the ‘first button’ of a chart.
1) Why is Wave 1 So Difficult to Identify?
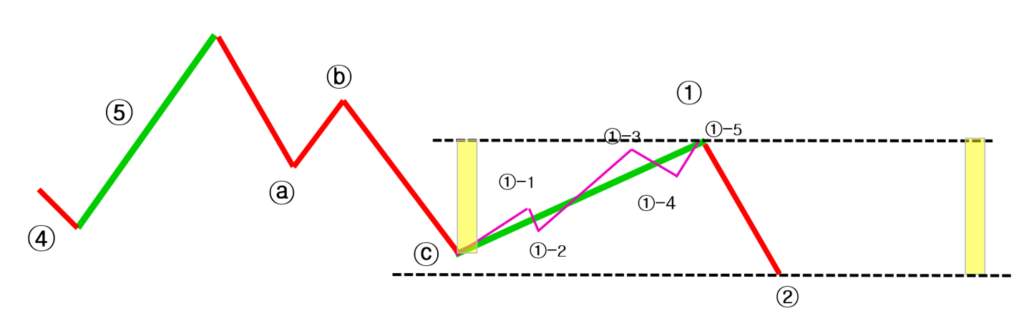
- Fractal Sub-structures: When viewed closely, Wave 1 is precisely composed of five smaller sub-waves (fractals).
- The Realm of Institutional Investors: This phase marks the stage where a small group of “Institutional Investors” or “Whales” begin to accumulate positions quietly. Consequently, it is extremely difficult for individual retail investors to detect this subtle shift occurring at the very end of a downward trend.
2) The Absolute Standard for Identifying a ‘Real’ Wave 2
When a pullback occurs after a rally, there is a clear standard to distinguish whether it is Wave 2—signaling a trend reversal—or simply an extension of the decline.
- The Law of the Low: The bottom of Wave 2 must absolutely stay above the starting point (the lowest low) of Wave 1.
- Failure to Comply: If the price drops below the starting point of Wave 1, it should be judged that the downward trend (often in the form of an x-a-b-c correction) is still in progress rather than a bullish reversal. In other words, the market bottom has not yet been confirmed.
3. Wave 2 : Retracement Ratios and Three Core Patterns
If Wave 1 was initiated by institutional accumulation, Wave 2 is a corrective phase driven by a mix of profit-taking and market fear. Precisely analyzing this interval is the key to capturing the entry point for Wave 3—the most powerful phase of the entire cycle.
1) Fibonacci Retracement: The Mathematical Anchor
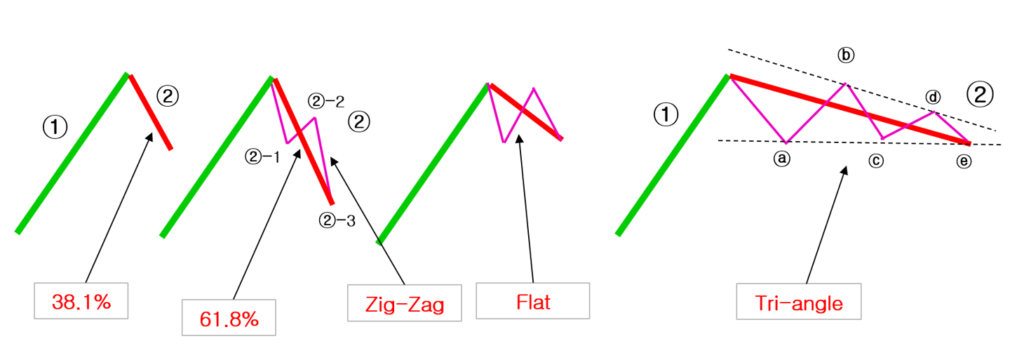
- Deep Corrections: Wave 2 often retraces a significant portion of Wave 1, typically seeking support at the 0.5 (50%) or 0.618 (61.8%) Fibonacci levels.
- Precision Entry: Identifying these levels allows for a high-probability entry before the explosive Wave 3 begins.
2) Psychological Sentiment
- The “Lesser” Fear: While Wave 2 feels like a return to the bear market, it is characterized by lower trading volume compared to the previous major decline, indicating that the selling pressure is exhausting.
3) The Three Major Patterns of Wave 2
Based on the visualized patterns, Wave 2 typically manifests in one of these three forms:
- Zig-Zag: This is the most classic and sharp corrective pattern. It concludes the retracement quickly and intensely, often reaching a deep correction level of 61.8% or more.
- Flat: In this pattern, the price moves sideways in a relatively horizontal range. This occurs when the downward pressure is weak and there is strong underlying buying support in the market.
- Triangle: This pattern takes the form of converging price action, where highs get lower and lows get higher, consolidating energy. Once the direction is established after this sideways movement, an explosive breakout typically follows.
[ Key Takeaways ]
Master the End of Wave 2 to Conquer Wave 3
- The Ultimate Buy Signal: If Wave 2 maintains its support at the 61.8% Fibonacci level without breaking the starting point of Wave 1, it serves as a powerful confirmation for a “Strong Buy.”
- Pattern Probability: Keep in mind that while a Zig-Zag is common, Flat or Triangle patterns often signal even higher anticipation for the next explosive rally.
4. Wave 3: Everything About the ‘Golden Wave’ for Maximizing Profit
If you could capture only one wave in Elliott Wave Theory, it should undoubtedly be Wave 3. This is because it is the longest, most powerful phase where the market’s collective energy is fully concentrated.
1) The Overwhelming Scale and Ratio of Wave 3
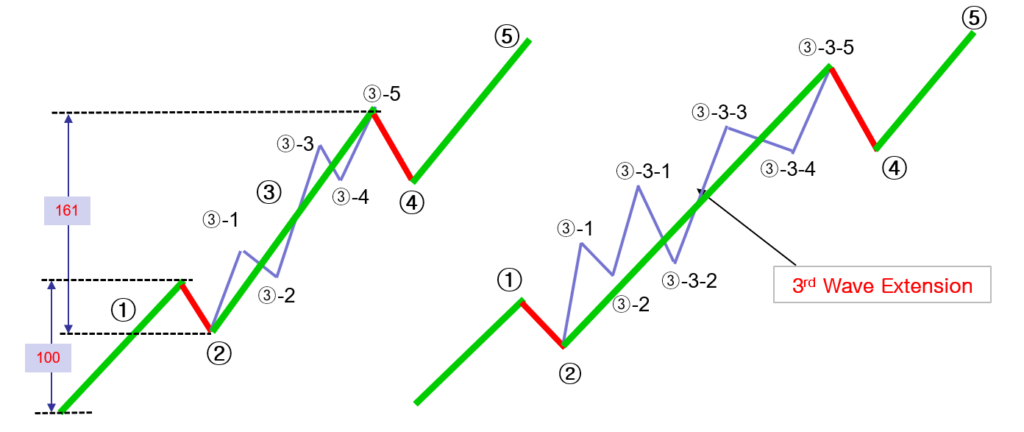
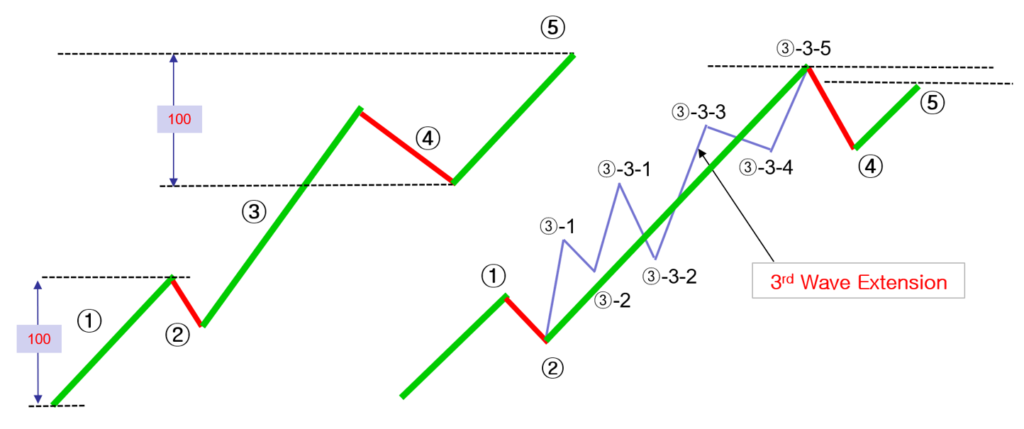
- The Core Rule: Wave 3 is almost always larger than Wave 1 and can never be the shortest among the three impulse waves (1, 3, and 5).
- The Golden Ratio: It typically extends to 1.618 times the length of Wave 1. This serves as powerful evidence of market conviction being reflected in price action.
- The 100 vs. 161 Principle: If Wave 1 advances by 100 units, it is the natural law of the market for Wave 3 to advance by at least 161 units.
2) Internal Structure and ‘Extension’
The ‘3rd Wave Extension’ highlighted on the right side of the image is the ultimate high-profit point that only seasoned investors can truly capture.
- Five Sub-waves: At its foundation, Wave 3 is composed of five smaller fractal waves.
- Powerful Extensions: When bullish momentum is exceptionally strong, Wave 3 often undergoes an extension, subdividing further into detailed sub-waves (e.g., ③-1 through ③-5). This creates an extended rally that seems to defy the expected peak.
3) The Peak of All Technical Indicators
Wave 3 reveals its dominance not only on the price chart but also through technical indicators.
- Explosive Indicators: Wave 3 is characterized by peak readings across all technical tools, including Trading Volume, MACD, RSI, and Stochastics.
- The Diagnostic: If the price continues to rise but technical indicators fail to keep pace, it is likely a weakening Wave 5 rather than a robust Wave 3. In a true Wave 3, price and momentum move in perfect, powerful harmony.
[ Key Takeaways] “Do Not Hesitate; Wave 3 is the Phase of Absolute Trend Conviction”
- The Reward for Patience: This is the ultimate gift granted to investors who have endured the consolidation and pullbacks of Wave 2.
- The Signal of the Prelude: The moment the price decisively breaks above the peak of Wave 1 with a significant surge in trading volume, you must recognize that the curtain has risen on Wave 3.
- Momentum Persistence: A critical characteristic of Wave 3 is that even when technical indicators enter “overbought” territory, the upward momentum does not easily falter but instead sustains its powerful acceleration.
5. Wave 4: The ‘Energy Consolidation’ Phase for the Final Spark
Wave 4 is the corrective period that emerges as the powerful momentum of Wave 3 begins to subside. This phase is not merely a price decline; rather, it is a critical juncture where the market reorganizes its strength and prepares for the final push of Wave 5.
1) The Rule of Retracement: The Mystery of 38.2%
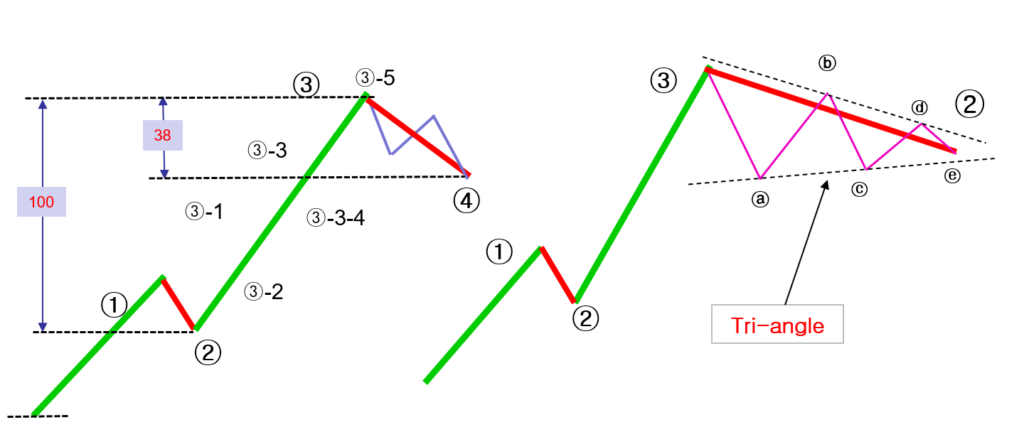
- Retracement Ratio: Wave 4 typically retraces approximately 38.2% of the preceding Wave 3 advance.
- Significance: Unlike Wave 2, which often involves a deep correction (61.8%), Wave 4 tends to be shallower. This indicates a strong underlying trend where buyers are waiting to enter on small dips.
- The 100 vs. 38 Principle: If we treat the massive gain of Wave 3 as 100 units, finding support after a 38-unit decline is a sign of a healthy correction, proving that the final rally is imminent.
2) The Rule of Alteration: Divergence from Wave 2
- The Rule of Alteration: A fundamental principle of Elliott Wave Theory is that Waves 2 and 4 tend to alternate in their corrective style.
- Pattern Analysis: If Wave 2 was a simple and sharp decline (e.g., a Zig-Zag), Wave 4 is highly likely to manifest as a complex, time-consuming sideways consolidation.
3) Typical Form of Wave 4: The Triangle Pattern
As highlighted on the right side of the image, the Triangle convergence pattern frequently emerges during Wave 4.
- Triangular Convergence: As highlighted on the right of the image, Wave 4 often appears as a Triangle pattern.
- Mathematical Precision: The internal waves within the triangle are often related to each other by a refined 61.8% ratio.
- The Outcome: Once this tedious convergence phase ends, the stored energy is explosively released toward the final Wave 5.
[ Key Takeaways ]
Wave 4 is the Phase of Patience and Your Final Opportunity
- The Inviolable Rule: The bottom of Wave 4 must never overlap with the peak of Wave 1. (This is a non-negotiable law of Elliott Wave Theory!)
- The Signal of Completion: Do not be discouraged by a tedious sideways triangle consolidation. The moment trading volume diminishes and the convergence is finalized, it is the optimal timing to position yourself for the final Wave 5.
6. Wave 5 : The Grand Finale and the Ultimate Exit Strategy
Wave 5, the final leg of the bullish rally, is a period where greed and caution coexist. While the price may continue to reach new highs, you must recognize that the internal energy is already beginning to cool down.
1) Length and Ratio of Wave 5 (Symmetry with Wave 1)
- The Rule of Equality: Typically, the length of Wave 5 tends to be equal or highly symmetrical to that of Wave 1.
- Expansion Ratios: Alternatively, Wave 5 often advances by approximately 61.8% of the total distance traveled from the start of Wave 1 to the peak of Wave 3. This allows investors to calculate a reliable final price target.
2) Critical Variable: Truncated Wave (Truncation)
As illustrated on the right, if the preceding Wave 3 was exceptionally powerful, the energy may be exhausted, causing Wave 5 to peak below the high of Wave 3.
- Warning Signal: Known as “Truncation,” this is a formidable warning sign indicating that a sharp and aggressive trend reversal is imminent.
3) Catching the Chart’s Deception: MACD Divergence
This is the most critical part of the chart. It serves as the definitive justification for selling your stocks.
- The Phenomenon: While the price may reach a new high in Wave 4, technical indicators such as MACD or RSI often fail to reach new peaks, showing a downward trend instead.
- The Conclusion: When this “Bearish Divergence”—where price (the appearance) and indicators (the essence) move in opposite directions—is detected, it is the definitive moment to realize profits and exit the market without hesitation.
[ Key Takeaways ]
Do Not Be Blinded by the Final Spark; Wave 5 is the Phase to Find Your Exit
- The Signal of Exhaustion: When the length of Wave 5 becomes similar to Wave 1, or when the MACD indicator begins to lose its upward slope, you must realize that the onset of the corrective A-B-C waves is imminent.
- The Ultimate Warning: The ‘Divergence’—where the price hits new highs while indicators trend lower—is the final ultimatum sent by the chart.
- Strategic Discipline: Following my “4 Principles for Success,” this is the moment to prioritize capital preservation over greed. As the underlying energy dissipates, a disciplined exit is what separates a professional from an amateur.
[ The Absolute Rules of the Chart: Core Guide to Elliott Wave Theory ]
There are definitive laws governing market trends. Beyond simple price movements, Elliott Wave Theory proves the repetitive patterns created by human psychology through mathematical precision.
1) Basic Structure: The 8-Wave Cycle
When a market shifts from its lowest point to a bullish trend, five upward waves (Impulse Waves) and three downward waves (Corrective Waves) form a single grand cycle that repeats infinitely.
2) Absolute Principles and Golden Ratios of Impulse Waves
Wave 3 is larger than Wave 1 and can never be the shortest among the impulse waves.
- The Length Law: Typically, Wave 3 releases immense energy, extending to 1.618 times the length of Wave 1.
- Wave 5 Extension: Often forming at 1.618 times the combined length of Waves 1 and 3, Wave 5 concentrates the final momentum of the trend.
3) No Overlap Rule (The Law of Wave 4)
- The bottom of Wave 4 must strictly remain above the peak of Wave 1.
- If Wave 4 overlaps with the territory of Wave 1, it indicates that the Elliott Wave structure is invalid or the wave counting is incorrect.
4) The Rule of Alteration: Form and Character
Waves have an inherent tendency to avoid resembling one another.
- Variance in Form: Waves 2 and 4 tend to exhibit contrasting shapes and characteristics.
- Characteristics of Wave 4: It frequently manifests as a Triangle convergence, signaling an impending explosive breakout for the final Wave 5.
The Elliott Wave Principle is not a tool for tracking the movements of a few, but rather for reading ‘Mass Psychology’.
- Predictive Power in Giants: Consequently, this theory demonstrates its most potent predictive power when applied to market indices and mega-cap blue-chip stocks that capture the grand flow of the market, rather than individual manipulated stocks.
- The Law of Large Numbers: Just as Lean Six Sigma relies on statistical significance to improve processes, wave analysis requires a large enough “sample size” of market participants to reveal its repetitive patterns accurately.
- Strategic Application: By focusing on high-quality assets like Apple,Samsung Electronics or the S&P500/NASDAQ indices, you minimize the “noise” of market manipulation and maximize the “signal” of authentic trend cycles.
[ Applicability of Elliott Wave: Why Large-Cap Stocks and Indices? ]
Elliott Wave is a tool for analyzing ‘Mass Psychology Patterns’. Therefore, it proves its true value in markets where collective intelligence is at its strongest.
- Reflecting Collective Psychology: The foundation of wave theory lies in common laws created by the combined emotions of countless investors. The principles of Elliott Wave align much more precisely with market indices (KOSPI, S&P 500) or top-tier market leaders than with small-cap stocks where a few participants can dictate price.
- Minimizing Chart Distortion: Small-cap stocks are susceptible to “whipsaws” caused by specific group interventions or temporary news. In contrast, large-cap stocks move according to massive capital flows, ensuring that “ironclad rules”—such as the length of Wave 3 or the non-overlap rule of Wave 4—remain intact.
- Abundant Liquidity: Higher liquidity leads to a stronger tendency for price movements to converge toward Fibonacci Golden Ratios (0.618, 1.618, etc.). This is a critical factor that enhances the overall accuracy of your technical analysis.
[ The Law of Volume: Catching the Deception in Charts ]
When in doubt about your wave counting, the answer lies in the volume. While prices can be manipulated, volume always tells the truth.
1) Proving Wave 3 (The Golden Wave)
- The Phenomenon: During Wave 3, the most powerful impulse wave, trading volume must increase explosively.
- The Law: If the price rises but the volume is lower than that of Wave 1, it is likely not a genuine Wave 3. A lack of volume signifies a weakening trend, so you must be wary of “fake breakouts.”
2) Convergence in Corrective Waves (Waves 2 & 4)
- The Phenomenon: During corrective phases (Waves 2 and 4), where the price temporarily declines or moves sideways, trading volume should decrease noticeably.
- The Law: Shrinking volume during a correction means “no one is willing to sell.” This is interpreted as a process of energy consolidation for the next upward wave (3 or 5). If volume spikes during a correction, you should suspect a trend reversal.
3) Volume Divergence in Wave 5
- The Phenomenon: In the final Wave 5, the price often reaches a new high, but the volume is frequently lower than it was in Wave 3.
The Law: A “Volume Divergence”—where the price rises while volume falls—indicates that the upward momentum is exhausted. This should be read as a powerful Sell Signal, suggesting that a sharp downward correction (A-B-C waves) is imminent.
“Deep Dive into Corrective Waves – Coming Up Next!”
The information provided above is for reference only; all investment decisions and responsibilities lie with the investor.
For more insights on manufacturing excellence and strategic transformation, read more post below.
Factory Turnaround Strategy in Vietnam
A Factory Turnaround Case Study: Turning Deficit into Profit in China
3 Lessons the Flea Experiment Teaches Us About Success
Discover more from mfginsights.net
Subscribe to get the latest posts sent to your email.