In today’s fierce global market, achieving a 30% Productivity Breakthrough is no longer just a goal—it’s a necessity for survival. When you’re dealing with messy supply chains and unpredictable labor costs, standing still means moving backward. That’s why having a clear, actionable roadmap to maximize your current resources is a must.
A premier example of this systematic drive for optimization is the Productivity Innovation Project (PIP) framework established by the company I have worked for over 12 years. Designed to foster operational acceleration, PIP serves as a master blueprint for transforming traditional production facilities into hyper-efficient, lean operations.
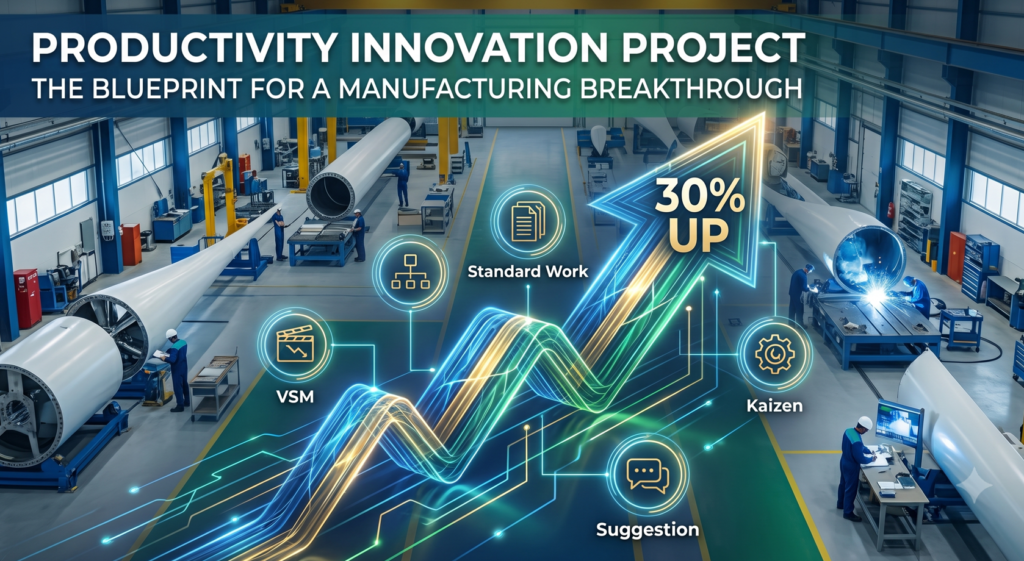
By targeting a definitive 30% increase in overall productivity and a 30% improvement in quality levels within a strict 6-week timeframe, the PIP methodology proves that radical transformation does not require years to execute—it requires precision, alignment, and an unwavering commitment to change.
1. The Strategic Alignment: The MQCD Framework
At the core of the PIP strategy is a classic manufacturing paradigm supercharged by cultural values: MQCD (Management, Quality, Cost, Delivery). Rather than treating operational metrics in isolation, the PIP framework anchors each pillar to a distinct corporate value, creating a cohesive push toward a singular breakthrough goal: Becoming a Global No. 1 company achieving a weekly output of 100 sections of wind tower.
| Pillar | Strategic Goal PDF | Anchor Value PDF |
| M (Management) | Innovative Leader Development | Passion: Igniting the internal drive to pioneer change. |
| Q (Quality) | Global Top Quality | Globalization: Implementing cross-border, world-class standards. |
| C (Cost) | Lowest Cost Production | Innovation: Constantly challenging existing operational baselines. |
| D (Delivery) | Shortest Lead Time | Speed: Eliminating bottlenecks to accelerate throughput. |
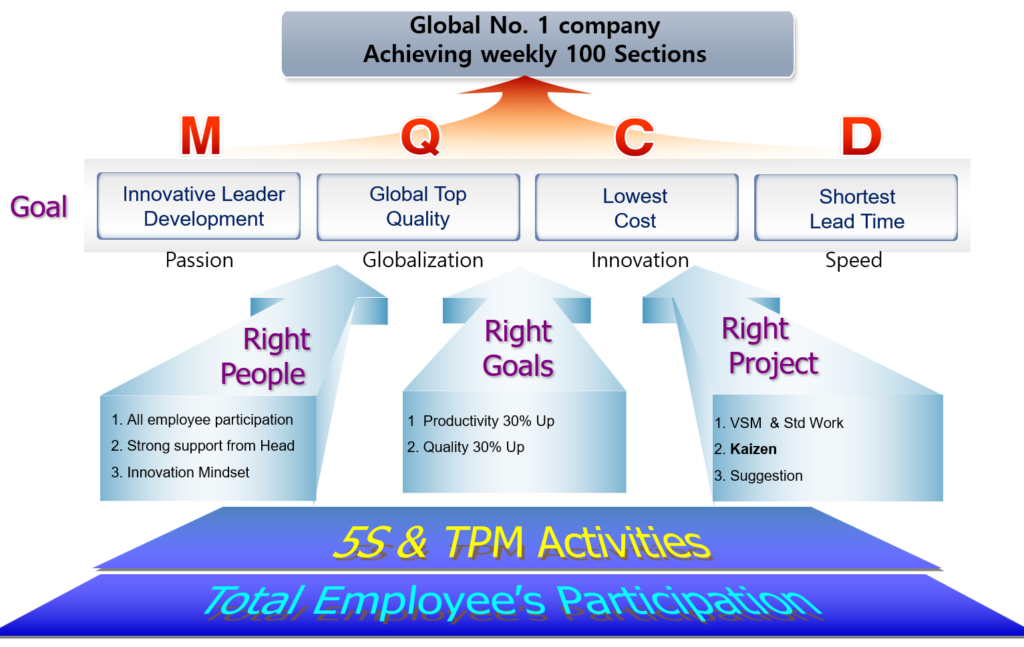
To support this structure, the program deploys three core tactical vectors:
- Right People: Driven by total employee participation, ironclad support from the Head of Entity, and a shared innovation mindset.
- Right Goals: Demanding an aggressive, simultaneous 30% upward surge in both productivity and quality metrics.
- Right Project: Executed through technical lean tools including Value Stream Mapping (VSM), Standardized Work, Kaizen, and structured suggestion systems.
Underpinning all of these elements are continuous 5S and Total Productive Maintenance (TPM) activities, ensuring the shop floor remains stabilized and physically optimized for high performance.
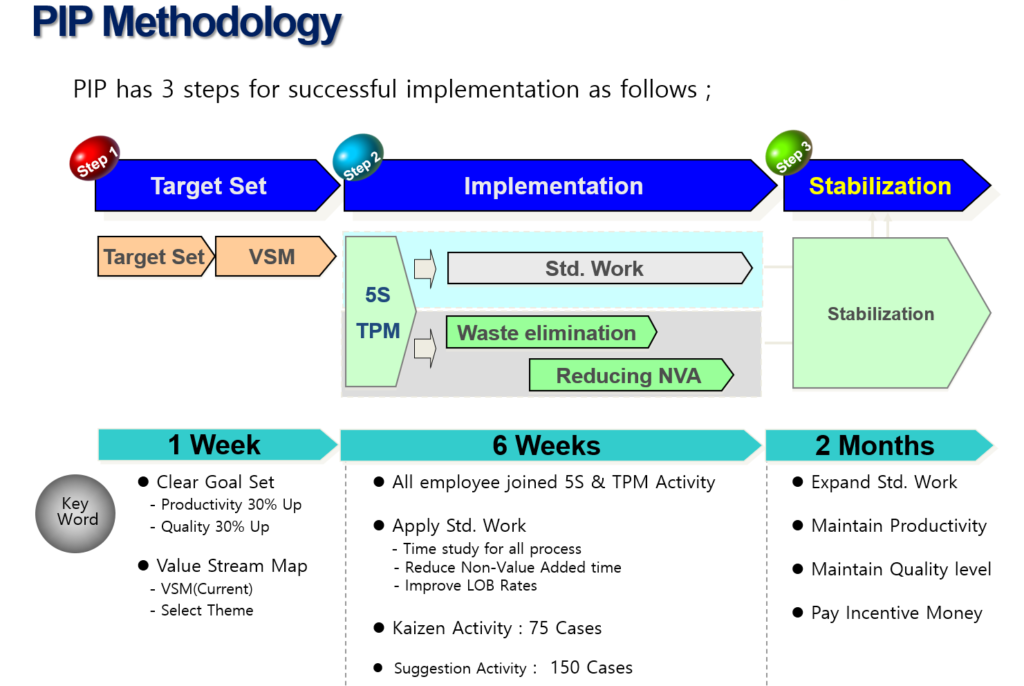
2. The 6-Week Execution Timeline and Step-by-Step Methodology
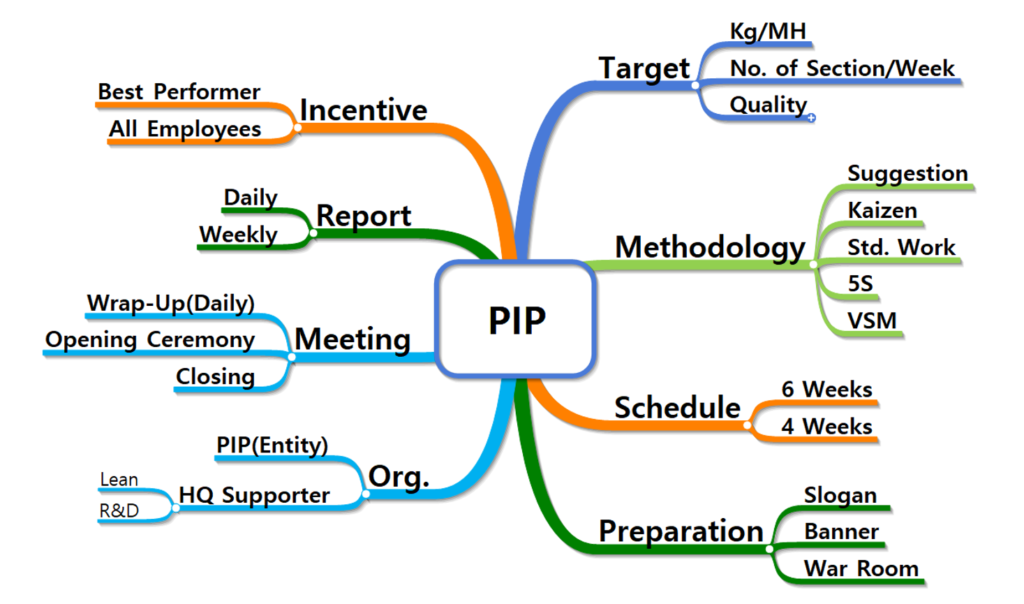
The genius of the PIP framework lies in its time-boxed intensity. The entire operational turnaround is concentrated into a highly disciplined sequence spanning a preparation phase, a six-week active implementation block, and a two-month stabilization window.
Phase 1: Preparation (1 Week)
Before the active clock begins, a comprehensive Baseline is calculated using data from the previous 6 months. This ensures all gains are measured against verified historical realities. The team then initiates the preparation stage:
- Establishing aggressive, unambiguous targets.
- Mapping the initial Value Stream Map (VSM) to highlight waste.
- Building dedicated cross-functional Task Force Teams (TFT).
- Setting up physical infrastructure, including a localized War Room, motivational banners, and program slogans to drive visibility.
Phase 2: Active PIP Implementation (Weeks 1 to 6)
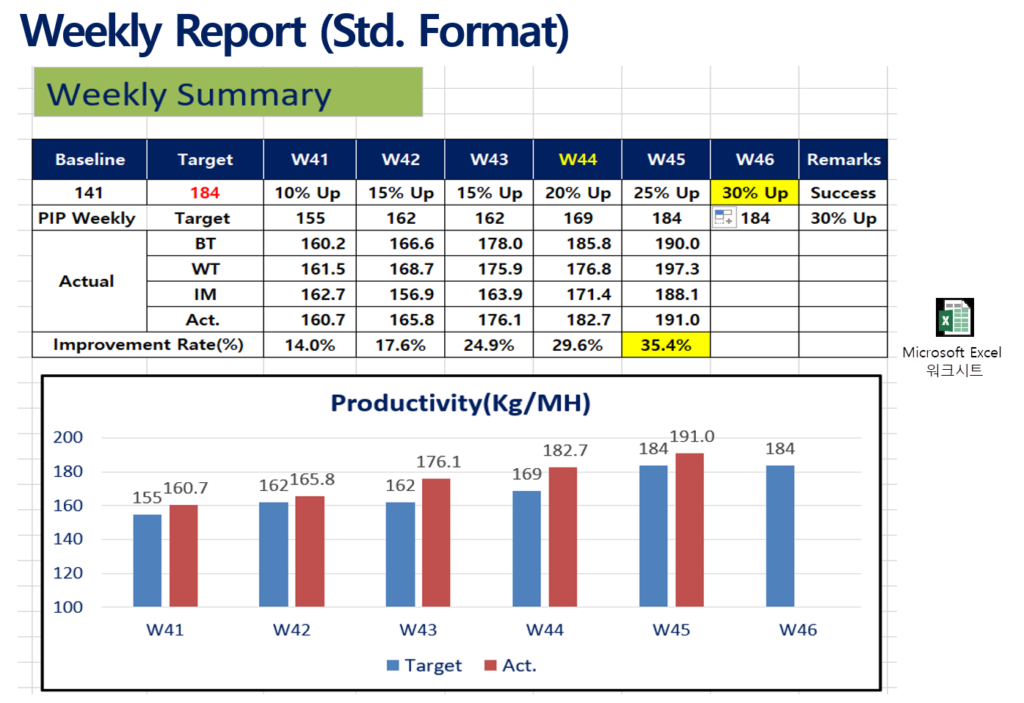
Progress is tracked through an incremental, week-over-week ramping mechanism. Efficiency is calculated using the key industry metric of kilograms per man-hour (kg/MH).
Taking a sample baseline of 68 kg/MH, the target climbs by exactly 5% every week across all core manufacturing divisions—BT, WT, and IM:
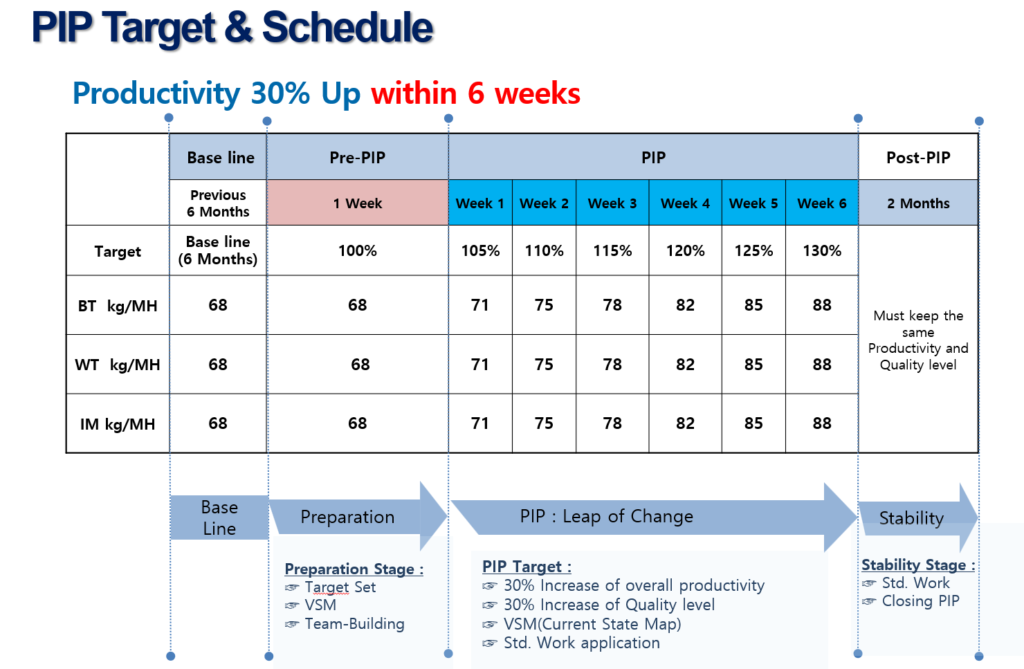
- Week 1 (105% Target): Moving to 71kg/MH via time studies and non-value-added (NVA) time reduction.
- Week 2 (110% Target): Reaching 75 kg/MH by freezing initial standardized work documents.
- Week 3 (115% Target): Climbing to 78kg/MH through focused waste elimination and Line of Balance (LOB) rate improvements.
- Week 4 (120% Target): Hitting 82kg/MH as Kaizen and suggestion card volumes begin scaling up.
- Week 5 (125% Target): Accelerating to 85kg/MH under rigorous shop-floor coaching and model line proliferation.
- Week 6 (130% Target): Reaching the peak performance of 88kg/MH, sealing the total 30% productivity gain.
Phase 3: Post-PIP Stabilization (2 Months)
A common failure point for rapid manufacturing interventions is the subsequent drop-off in performance. The PIP methodology mitigates this by mandating a 2-month stabilization period. During this phase, the facility is audited regularly to expand standardized work protocols, maintain the newly achieved quality levels, and lock in the 130% productivity plateau as the permanent corporate standard.
3. Core Lean Tooling: Value Stream Mapping & Standardized Work
A 30% breakthrough cannot be achieved by simply telling operators to “work harder.” It requires a deep dive into engineering data via VSM and Standardized Work documentation.
Value Stream Mapping (VSM) Case Study
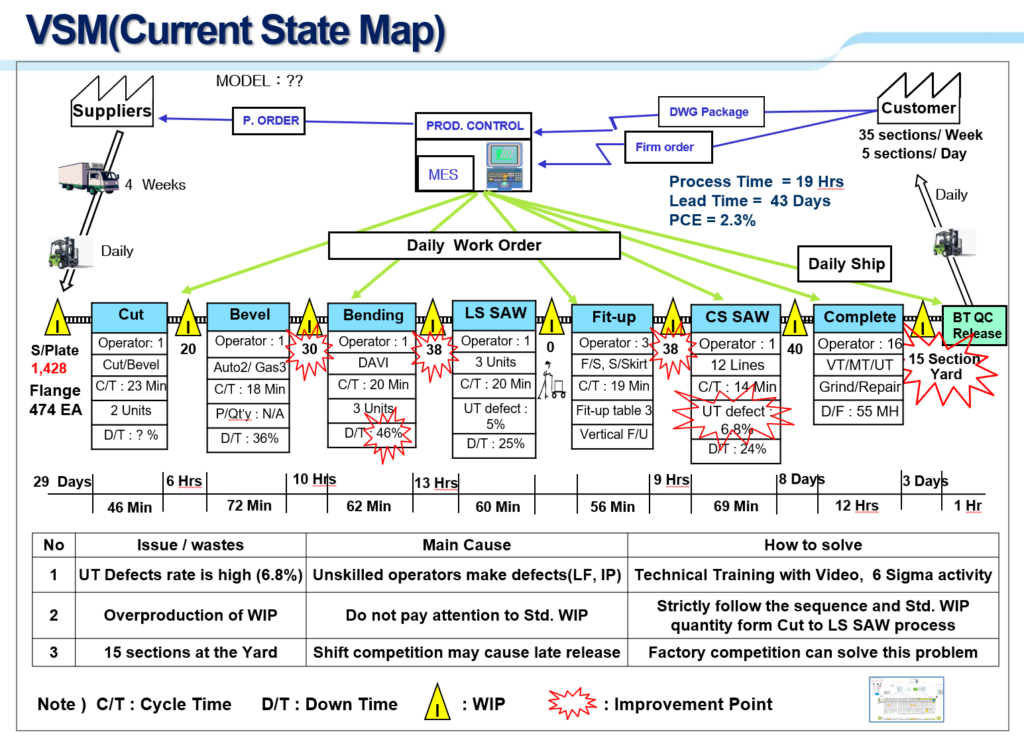
By looking at a representative current state map for a production line yielding an efficiency profile of Process Time = 19 Hours, Lead Time = 43 Days, and Process Cycle Efficiency (PCE) = 2.3%, the framework identifies major structural losses:
- High Defect Rates: A 6.8% UT defect rate caused by unskilled operators generating Lack of Fusion (LF) and Incomplete Penetration (IP) flaws. The PIP Solution: Target this via immediate technical video training and focused Six Sigma activities.
- Excessive Work-in-Process (WIP): Severe overproduction of WIP sitting between cutting and Long-Seam (LS) SAW processes due to sequence neglect. The PIP Solution: Institute strict adherence to optimized sequences and defined Standard WIP limits.
- Yard Bottlenecks: Large accumulations of sections (e.g., 15 sections) delayed in the yard due to unregulated shift competitions causing late QA releases. The PIP Solution: Restructure plant competitions to incentivize final throughput over localized shift metrics.
Proliferation of Standardized Work (Std. Work)
To lock down these fixes, a multi-month, formalized Standardized Work roadmap is rolled out across all production lines:
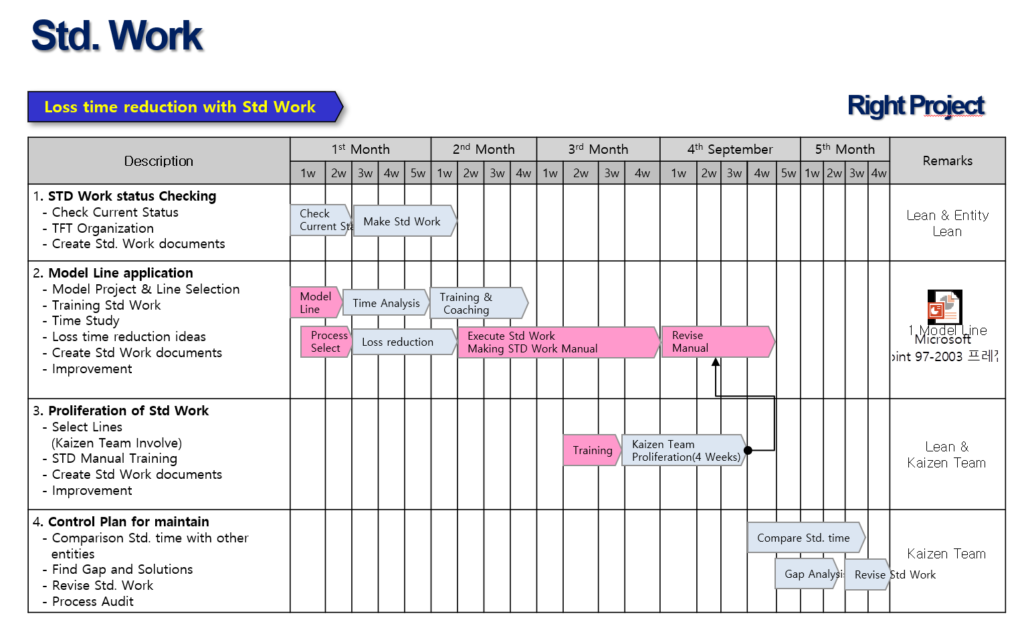
This ensures that every process step, down to the minute, is optimized, safely sequenced, and fully repeatable across any shifts.
4. Total Employee Engagement: Suggestion Systems & Kaizen
True lean transformation is bottom-up. The PIP framework establishes fixed, quantifiable targets for employee ideas during the 6-week blitz, demanding a total of 150 Suggestion Cases and 75 Kaizen Cases :
Suggestion Cards Target Distribution (6-Week Target: 150 Total Cases)
- Black Tower Team (BT): 50 Cases
- White Tower Team (WT): 25 Cases
- Internal Mounting Team (IM): 15 Cases
- Quality Control / Quality Assurance (QC/QA): 15 Cases
- Project Management / Environment, Health & Safety (PM/EHS): 15 Cases
- Supply Chain Management / Engineering (SCM/Eng.): 15 Cases
- Human Resources / Finance: 15 Cases
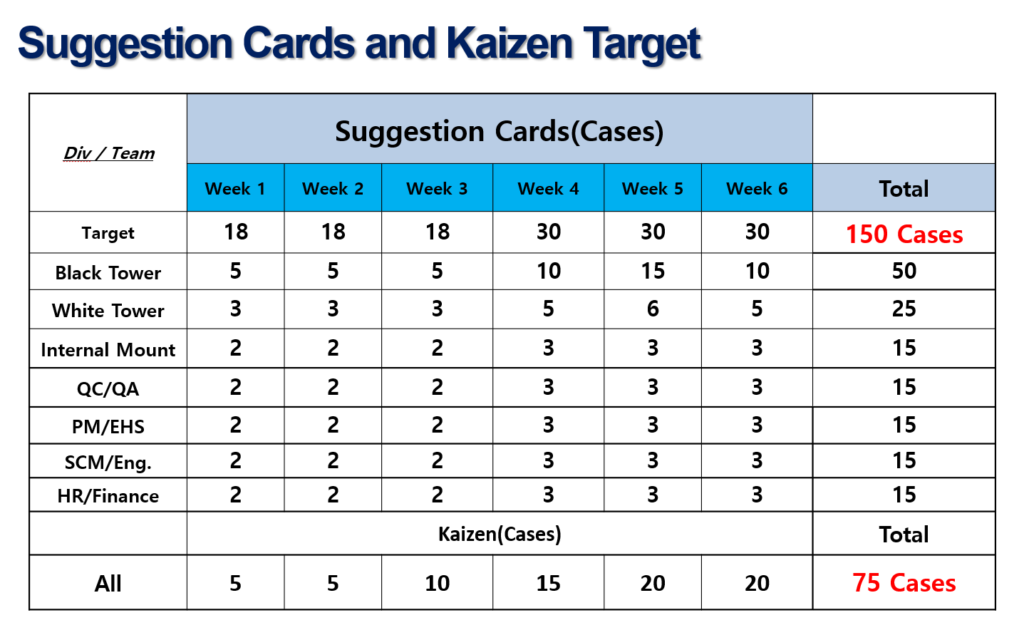
By requiring every division—including indirect corporate offices—to feed into the suggestion pipeline, the culture shifts away from passive observation into active, daily problem-solving.
5. The Financial Engine: Incentive Architecture and Cost Savings
To align the workforce with these aggressive milestones, the PIP framework pairs its operational demands with a highly rewarding, region-adjusted incentive structure.
Performance-Based Weekly Pay Scales
When a division successfully hits its week-over-week performance targets of 30% Productivity Breakthrough, direct financial payouts are distributed immediately to direct labor personnel:
| Achieved Improvement Rate | North America (USD) | Western Europe (EUR) | Middle/East Europe (EUR) | Asia (USD) | South Korea (KRW) |
| 10% – 19% Up | $20 | €20 | €15 | $10 | ₩20,000 |
| 20% – 29% Up | $50 | €50 | €40 | $25 | ₩50,000 |
| 30%+ Peak Target | $100 | $100 | €75 | $50 | ₩100,000 |
| Weekly Best Employee | $100 | $100 | €75 | $50 | ₩100,000 |
The Macro Financial Impact
While funding these immediate payouts requires a localized budget, the overarching financial return on investment (ROI) is staggering. When calculating the annualized impact of 30% Productivity Breakthrough across multiple global branches, the net savings completely overshadow the program’s administration costs.
Look at the real world, cross-border performance matrix below:
By deploying a mere $1.3 million in incentive payouts in 6 entities, the organization recaptures over $22 million in gross labor waste, yielding an outstanding net corporate savings of $20,735,105 in just one year. The math is clear: incentivizing frontline workers is the most profitable decision management can make.
6. The Human Element: Why Innovations Fail or Succeed
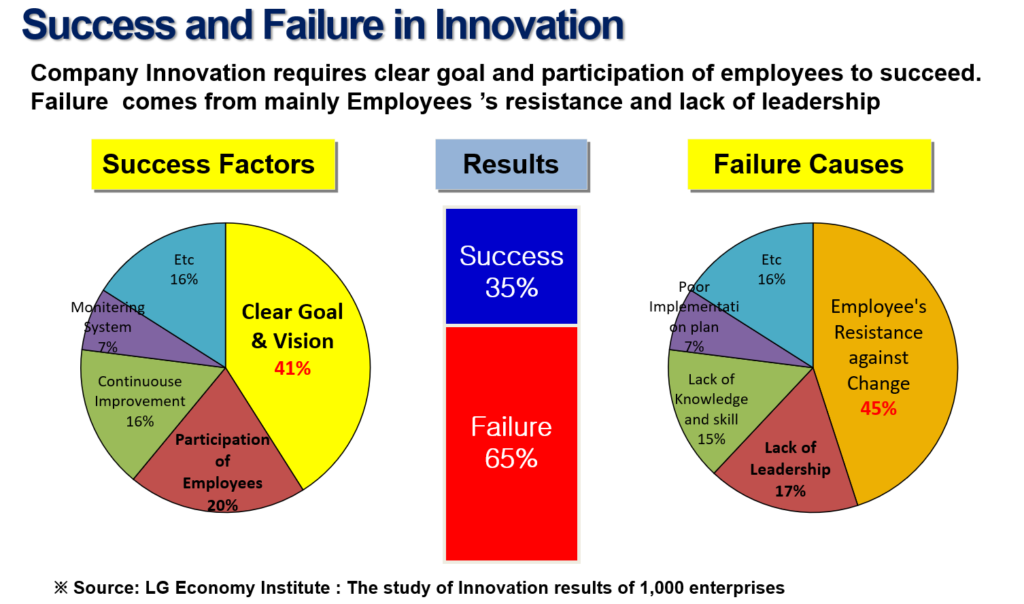
Data, timelines, and financial models are excellent on paper, but actual execution rests entirely on organizational psychology. Comprehensive research compiled by the LG Economic Institute across 1,000 corporate enterprises reveals a sobering reality: Only 35% of corporate innovation initiatives succeed, while 65% fall into complete failure.
Understanding the exact forces behind these charts is critical for any plant manager attempting an operational turnaround.
Top Reasons for Innovation Failure
- Employee Resistance Against Change (45%): The single largest threat. Human beings naturally revert to comfortable habits unless carefully coached into new paradigms.
- Lack of Leadership (17%): Initiatives that lack energetic, visible executive sponsors wither quickly.
- Lack of Knowledge and Skill (15%): Expecting higher output without training staff on advanced lean methodologies like standard time studies or VSM.
- Poor Implementation Planning (7%): Vague goals without structured weekly roadmaps.
Key Drivers for Innovation Success
Conversely, when analyzing the successful 35%, two core variables dominate the landscape:
- Clear Goal & Vision (41%): Everyone on the floor knows the exact daily and weekly targets.
- Participation of Employees (20%): Giving the front lines direct ownership through suggestions and financial incentives.
The PIP framework targets exactly these findings. It counters resistance through shared incentives, updates management instantly via structured daily and weekly reporting lines to executive management (including the CEO and Chairman), and establishes an immutable, highly transparent vision.
For more insights on manufacturing excellence and strategic transformation, read more post below.
Factory Turnaround Strategy in Vietnam
A Factory Turnaround Case Study: Turning Deficit into Profit in China
3 Lessons the Flea Experiment Teaches Us About Success
Discover more from mfginsights.net
Subscribe to get the latest posts sent to your email.