If you are a manager, plant manager, or senior leader working in a manufacturing facility, there is one indispensable continuous improvement tool you must master to drastically boost productivity: Value Stream Mapping (VSM).
Introduced globally as a core element of the Lean manufacturing framework, Value Stream Mapping provides organizations with a visual blueprint to identify operational bottlenecks and remove non-value-added activities.
1. What is Value Stream Mapping (VSM)?
A Value Stream Mapping (VSM) is a specialized flowchart that visualizes every single step involved in bringing a product or service from the initial supplier to the end customer. It maps two critical dimensions simultaneously: the flow of materials and the flow of information.
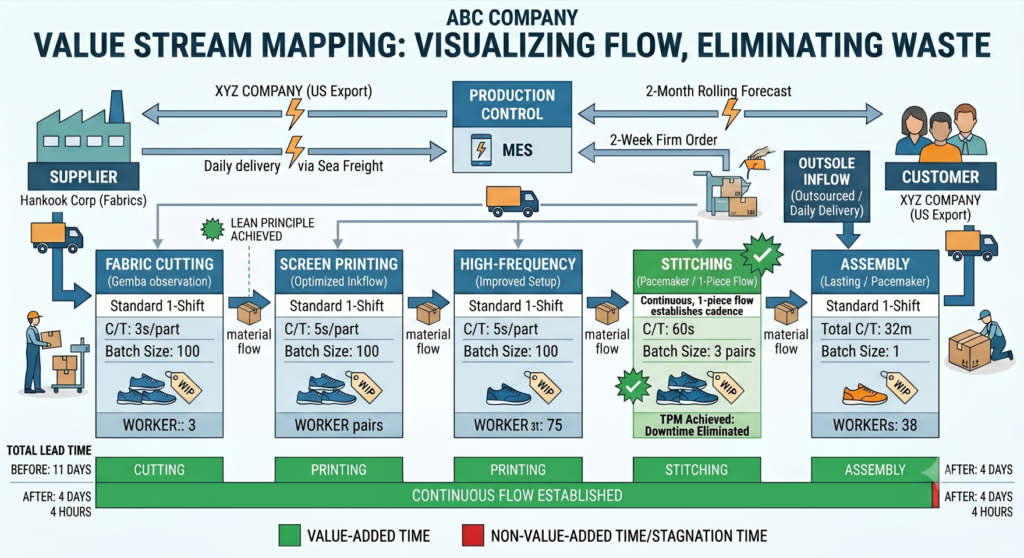
The true power of a VSM lies not just in drawing sequential boxes, but in strictly separating Value-Added Time (VA) from Non-Value-Added Time (NVA / Stagnation) across the entire manufacturing pipeline.
2. Why Should Managers Use Value Stream Mapping?
- Total Optimization: Instead of focusing on local efficiencies (which often lead to overproduction), VSM enhances the Overall Efficiency of the complete supply chain.
- Visualization of Waste: It shines a light on hidden, invisible wastes such as excessive Work-in-Process (WIP) inventory, long lead times, and transport delays.
- A Common Language: It provides plant managers, engineers, and shop-floor operators with a single, shared visual map to align on tactical Kaizen projects.
3. The 5-Step Process of Value Stream Mapping
To successfully implement a VSM on your shop floor, follow this structured 5-step methodology:
- Select a Product Family: Choose a high-impact product line or a group of products that share similar manufacturing steps.
- Draw the Current State Map: Go to the shop floor (Gemba Walk) and map the actual, current flow of materials and information exactly as it happens, without idealizing it.
- Analyze Value and Waste: Measure key metrics like Cycle Time (C/T), equipment uptime, and WIP inventory levels to locate non-value-added steps.
- Design the Future State Map: Architect an idealized, lean flow by eliminating identified wastes. Introduce Pull systems, Kanban, and align processes to Takt Time.
- Formulate a Continuous Improvement Plan: Develop concrete execution strategies and Kaizen projects to bridge the gap between the current state and the future state.
4. Key Metrics and Operational Parameters for VSM
Before mapping the floor, you must collect operational realities and data points. Below are the key engineering metrics and the specific case baseline for a footwear manufacturing plant exporting 100% of its products to the U.S. market.
A. Core Metrics Checklist
- C/T (Cycle Time): The time it takes to complete a single process block for one unit.
- C/O (Change Over): The duration required to switch a machine or line from one product type to another.
- Uptime: The operational reliability and availability percentage of machinery.
- Lead Time: The total time elapsed from raw material introduction to final product shipment.
B. Customer Requirements & Production Schedule
- Monthly Demand: 16,000 pairs / Daily Demand: 800 pairs (Determines the process Takt Time).
- Packaging Unit: 10 pairs per box (80 boxes shipped daily).
- Logistics: Daily truck delivery to the port; strict delivery terms where delayed shipments require expensive air freight penalized at the supplier’s expense.
- Operating Calendar: 20 days per month.
- Shift Structures: * Prep Processes (Cutting, Printing, High-Frequency): 2-shift operation.
- Assembly Processes (Stitching, Lasting/Assembly): 1-shift operation (8 hours).
- Supply Chain Inputs: Raw fabrics supplied by ‘Hankook Corp’; Outsoles outsourced externally with a daily delivery of 800 pairs (current safety stock held at 1,600 pairs).
- Information & Production Control: 2-month rolling forecast followed by a firm order 2 weeks prior to production. Production schedules are released weekly via MES to individual departments, while delivery calls are processed daily.
5. Case Study: Process Data Analysis of ABC Company
The following data sets represent the current manufacturing parameters before the lean optimization cycle.
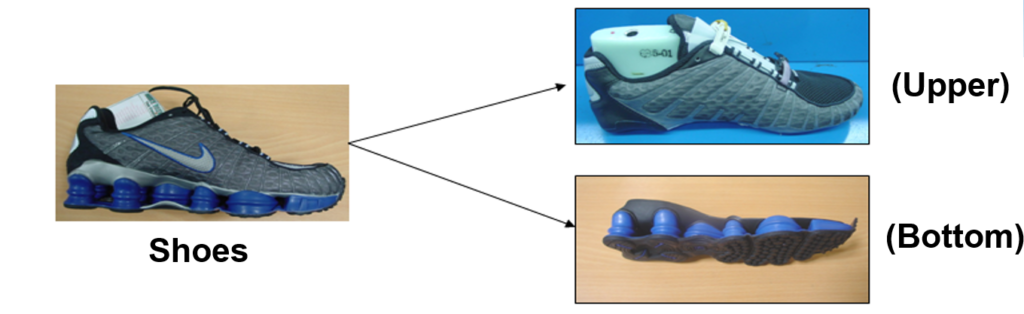
Process 1: Upper Part Manufacturing (Upper)
| Process Name | Shift System | Operators & Machinery | Cycle Time (C/T) | Batch Size | Observed WIP Inventory | Uptime / Special Notes |
| 1. Fabric Cutting | 2 Shifts | 6 Operators / 3 Units | 36 sec (3 sec/part) | 100 pairs | Pre: 6 days / Post: 200 pairs | 100% Uptime |
| 2. Screen Printing | 2 Shifts | 6 Operators / 3 Units | 60 sec (5 sec/part) | 100 pairs | Pre: 200 pairs / Post: 200 pairs | 100% Uptime |
| 3. High-Frequency | 2 Shifts | 6 Operators / 3 Units | 60 sec (5 sec/part) | 100 pairs | Pre: 200 pairs / Post: 400 pairs | 90% Uptime |
| 4. Stitching (Sewing) | 1 Shift | 90 Operators / 3 Lines | 1 min per sub-process | 3 pairs | Pre: 200 pairs / Post: 400 pairs | 5 min Downtime (D/T) |
| 5. Assembly (Lasting) | 1 Shift | 50 Operators / 1 Line | 32 min total | 1 pair | Pre: 800 pairs / Post: 1,400 pairs | 10 minutes D/T, 1-piece flow |
Process 2: Outsole(Bottom) Inflow
- Outsole components are fed into the main stream directly prior to the final Assembly Line, matching one-to-one with the finished uppers.
6. Current State Analysis: 7 Hidden Wastes Identified
When examining the Current State Map of this production line, several severe systemic inefficiencies and structural mismatches become clear:
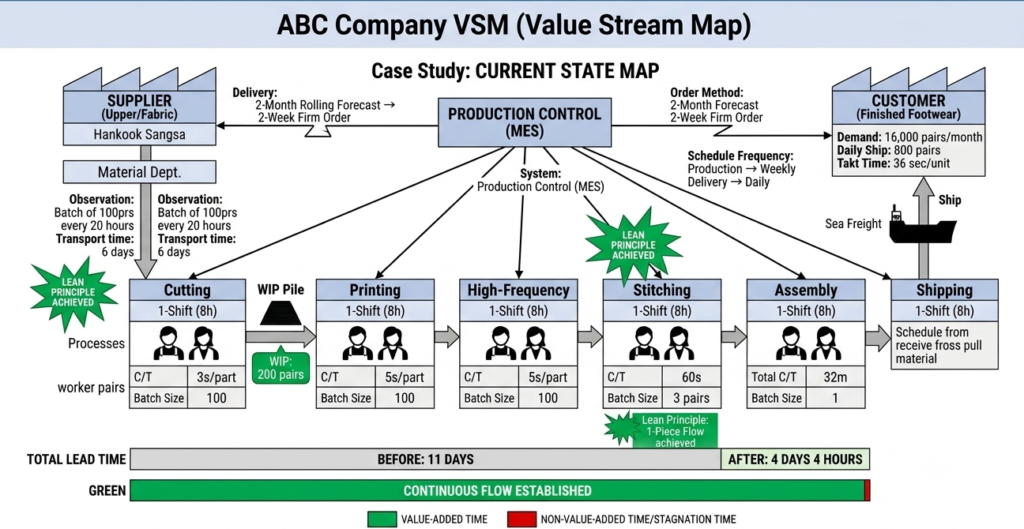
- Repetitive Inventory & Excessive Transport: Fabric cutting, screen printing, and high-frequency welding are physically segregated. This fragmentation results in massive buffer piles and heavy material handling waste between stations.
- Over-Complicated Information Flow: Pushing independent weekly MES schedules to every isolated department degrades flexibility and leads to scheduling conflicts.
- The Penalty of ‘Push’ Processing: Manufacturing in large batches of 100 pairs and blindly pushing them to the next stage traps capital in unnecessary WIP.
- Shift Mismatch Stagnation: Running preparatory stages on 2 shifts while the core stitching and assembly lines run on 1 shift creates massive waiting times and overnight stagnation.
- Micro-Downtimes: Unscheduled equipment stops of 5 to 10 minutes in stitching and assembly quietly erode overall capacity.
- Interrupted Flow Mechanics: Even with small-batch movements (3 pairs) in stitching, the line lacks a balanced continuous cadence, creating micro-bottlenecks.
- Institutionalized Buffer Waste: A baseline inventory of 400 pairs caused by shift imbalances has become accepted as normal, masking the true root causes of shop-floor instability.
7. Future State Architecture: Lean System Transformation
To reconstruct this broken flow, a 7-point design guide was deployed to generate 9 strategic action items for the future state map.
A. The 7 Lean Design Principles
- Principle 1: Produce strictly to Takt Time to prevent structural overproduction.
- Principle 2: Establish continuous, one-piece flow wherever physically viable.
- Principle 3: Use Pull systems (Kanban) where continuous flow is impossible.
- Principle 4: Send the production schedule to a single process—the Pacemaker (Assembly).
- Principle 5: Define clear, visible targets for every Kaizen burst point.
- Principle 6: Level the production mix by running small, frequent product lots.
- Principle 7: Roll out a phased implementation plan to secure long-term stability.
B. The 9 Strategic Action Items & Expected Impacts
| Classification | Core Action Item | Expected Impact |
| Operational System | Synchronize Cutting/Printing/High-Frequency from 2 shifts to 1 shift. | Balances the factory layout; drastically drops waiting buffers. |
| Information Flow | Centralize scheduling at the Pacemaker; deploy a Pull System. | Eliminates overproduction; slashes MES data clutter. |
| Process Efficiency | Execute Focused TPM to eliminate the 5-10 min machine downtimes. | Optimizes equipment uptime; compresses manufacturing lead time. |
| Flow Engineering | Convert the stitching line from a 3-pair batch to a strict 1-piece flow. | Minimizes floor WIP; establishes predictable lead times. |
| Logistics Design | Position a standard Supermarket buffer; minimize transit pathways. | Slashes transport waste; stabilizes downstream material pulling. |
| Supply Chain | Cut the raw material replenishment cycle by 50%. | Lowers warehouse storage costs and cuts material lead time. |
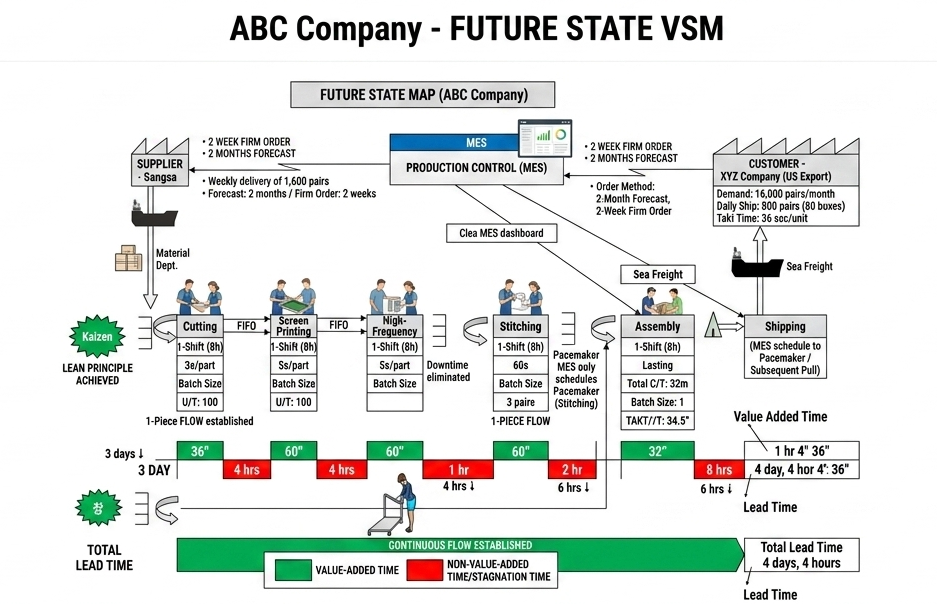
8. Lean Transformation Results: The Power of Data
By transforming the theoretical map into shop-floor reality, the operation achieved substantial quantitative and qualitative performance breakthroughs.
Quantitative Improvement Metrics
| Operational Metric | Before Kaizen | After Kaizen | Verified Business Impact |
| Manufacturing Lead Time | 11 Days | 4 Days 4 Hours | Over 60% compressed (Accelerated customer response) |
| Stitching Line Personnel | 108 Operators | 75 Operators | 30% boost in labor productivity |
| Shop Floor Footprint | 100% Baseline | 50% Baseline | 2x space utilization (Eliminated storage zones) |
| Defect Rate | High / Variable | Drastically Reduced | Immediate defect detection via continuous flow |
Qualitative Milestones
- Ergonomic & Shift Optimization: Shifting the entire plant to a standardized 1-shift framework drastically mitigated worker fatigue and boosted daily morale.
- Scrap & Material Loss Mitigation: The implementation of a structured Kanban pull sequence balanced inter-process volume, resulting in an immediate reduction in material scrap and transit damage.
Conclusion: VSM is the Roadmap to Operational Excellence
A Value Stream Mapping is far more than an engineering diagram or a floor drawing. Its true value lies in its ability to bare your operation’s hidden inefficiencies and align an entire organization around a unified vision of continuous improvement.
Compressing a bloated 11-day lead time down to a highly responsive 4-day cycle is how modern manufacturing facilities secure their global competitiveness. The process of mapping requires disciplined effort, but the resulting yield in productivity gains proves its worth to any lean organization.
“Hungry for more? Check out these related posts.”
Productivity and Safety: Employee Engagement
Discover more from mfginsights.net
Subscribe to get the latest posts sent to your email.