To really stand out in today’s competitive manufacturing market, we need to focus on continuous improvement. That means making decisions based on data, staying precise, and solving problems systematically. Among various production methodologies, plastic injection molding stands out as a process highly sensitive to environmental variables, material integrity, and equipment stability. Even a minor deviation in the production ecosystem can trigger a cascade of quality issues, leading to skyrocketing defect rates, wasted materials, and compromised delivery timelines.
This comprehensive case study examines a highly successful quality improvement initiative executed through the structured lenses of quality framework. By scrutinizing Key Performance Indicators (KPIs) and targeting the root causes of injection molding failures, this project showcases how systematic engineered interventions can dramatically slash parts-per-million (PPM) defect rates and elevate overall operational efficiency.
1. The Baseline: Evaluating the KPI Landscape
Every successful Six Sigma and Lean manufacturing initiative begins with an honest, data-driven assessment of the current state. Establishing a baseline (BM) allows project teams to quantify the gap between actual performance and organizational targets. In this initiative, the team evaluated a robust matrix of KPIs across delivery, internal quality, productivity, and inventory management.
The Initial Performance Metrics
Prior to the focused improvement activities, the production line faced multi-dimensional challenges from January to March:
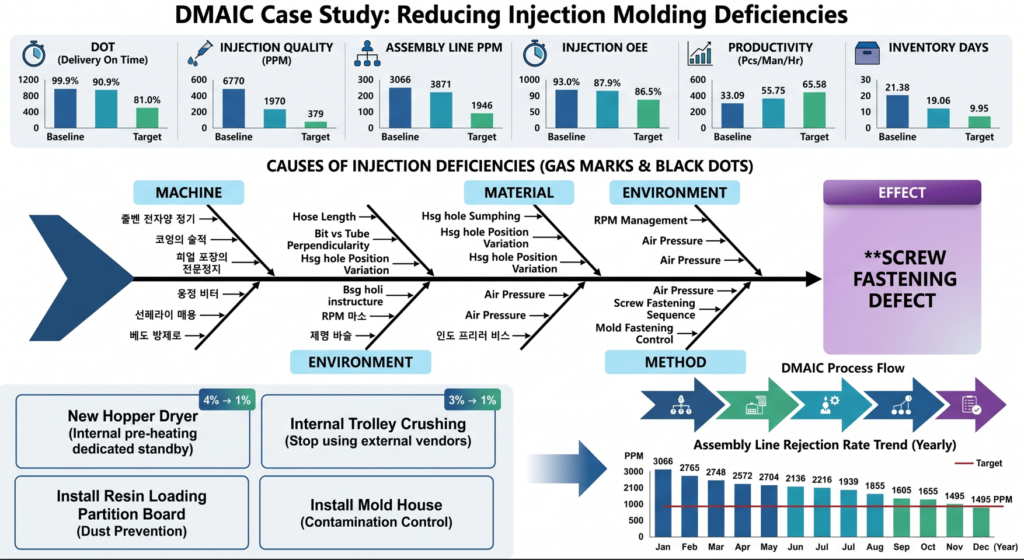
- Delivery On Time (DOT): Stagnating at 88.8%, falling significantly short of the world-class 100% target.
- Injection Quality Defect Rate: Hovering at a high baseline of 11,645 PPM, presenting the single largest area of financial and material waste.
- Overall Equipment Effectiveness (OEE) for Injection: Operating at a suboptimal 55%, compared to an aggressive optimization target of 80%.
- Labor Productivity: Recorded at 47 Pcs/Man/Hr, with a strategic goal to push output to 70 Pcs/Man/Hr.
- Inventory Days: Tied up at 10 days, creating cash flow inefficiencies where the lean target demanded a reduction to 6 days.
The Pareto principle dictates that 80% of problems stem from 20% of causes. In this manufacturing environment, it was clear that the massive 11,645 PPM defect rate in the injection molding process was the critical bottleneck undermining both OEE and on-time delivery. Consequently, the team aligned its resources to surgically address injection quality.
2. Analyzing the Root Causes of Injection Defects
To effectively reduce the injection defect rate, the team broken down the aggregate PPM data to identify the specific failure modes in details. A Pareto analysis of the injection molding defects revealed a clear distribution of quality issues as follows ;
| Defect Classification | Percentage Contribution |
| Gas Marks | 32% |
| Black Dots | 20% |
| Short Molds | 17% |
| Sink Marks | 4% |
| Flow Marks | 0% |
| Others | 27% |
With Gas Marks (32%) and Black Dots (20%) accounting for more than half of all quality rejections, the analysis phase focused heavily on the variables affecting these two phenomena.
The Physics of the Failures
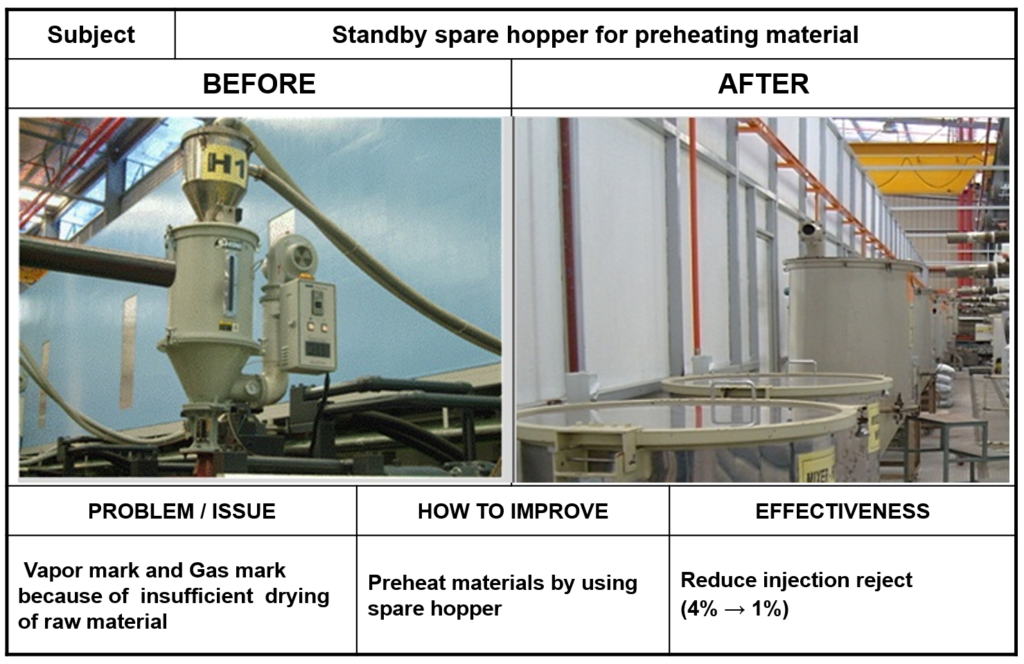
- Gas Marks: Typically triggered by trapped volatile gases or insufficient moisture removal from the raw polymer resin before it enters the injection screw. When resin is improperly dried, vapor and trapped air are forced into the mold cavity under immense pressure, scorching the surface or creating silver streaks.
- Black Dots: Primarily caused by contamination. Airborne dust settling on the molds, airborne particulates falling into raw material hoppers, or degraded carbonized material from external regrind vendors entering the melt stream manifest as visible black specks on the finished product.
3. Systematic Engineering Improvements: Action and Implementation
Once the vital few failure modes were isolated, the project team designed and executed a series of hardware and environmental countermeasures. The primary focus was on isolating the materials and equipment from contamination while optimizing the pre-heating and drying processes.
Countermeasure 1: Upgrading Resin Drying Systems
To battle the prominent 32% Gas Mark defect rate, the team realized that the existing setup was failing to achieve consistent, optimal moisture removal. The action plan involved a complete overhaul of the drying architecture:
- Before: Centralized or standard hopper setups failed to keep up with the continuous throughput, causing raw material to be processed with insufficient drying times.
- After: The installation of a New Hopper Dryer system specifically calibrated for the material’s throughput. This was supplemented by introducing a standby spare hopper dedicated solely to preheating raw materials. Preheating ensures that the polymer matrix enters the primary drying zone at an elevated temperature, maximizing moisture desorption and completely eliminating vapor or gas mark formations.
Countermeasure 2: Mitigating Contamination via Structural Isolation
Black dots are an environmental and material handling discipline issue. The team introduced two major structural barriers to isolate the sensitive molding zone from external dust:
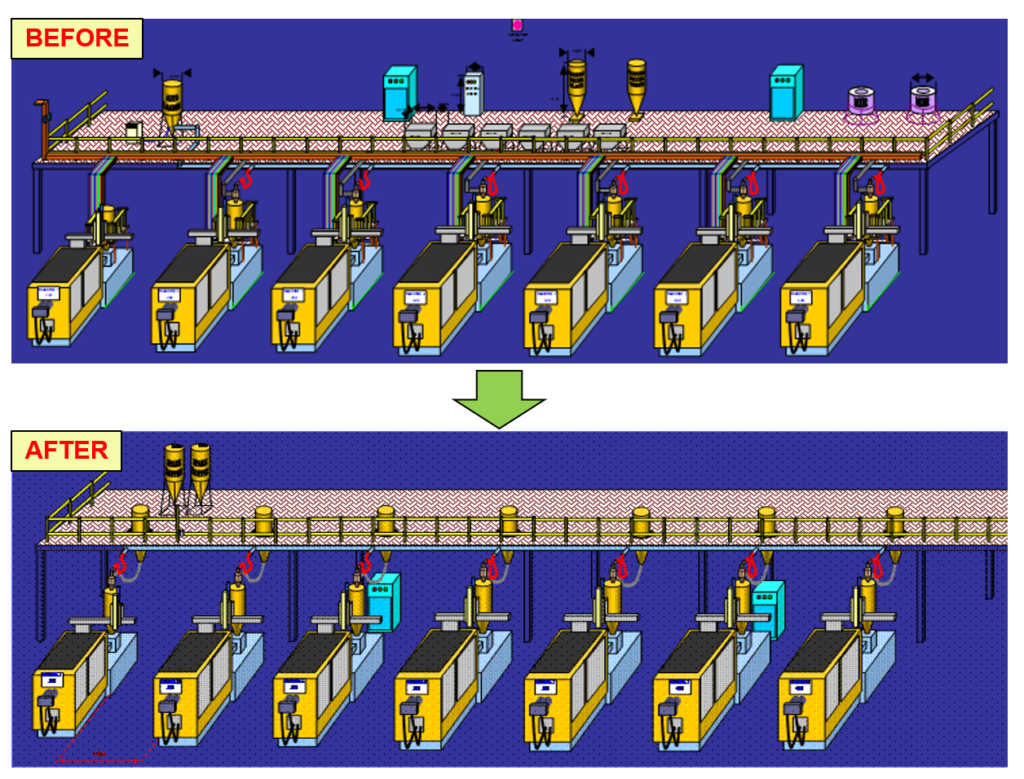
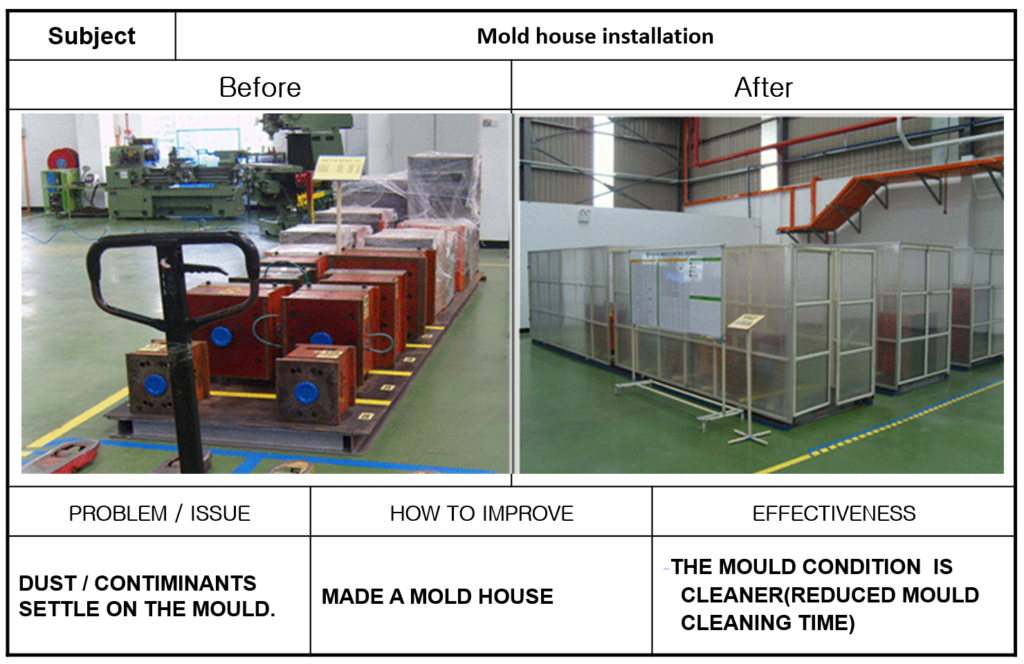
- Mold House Installation: Molds were historically stored or staged open to the shop floor environment, allowing ambient dust and industrial contaminants to settle directly onto the high-precision mold surfaces. The team constructed a dedicated, enclosed Mold House. This clean storage environment drastically reduced mold cleaning times and prevented early-stage micro-contamination.
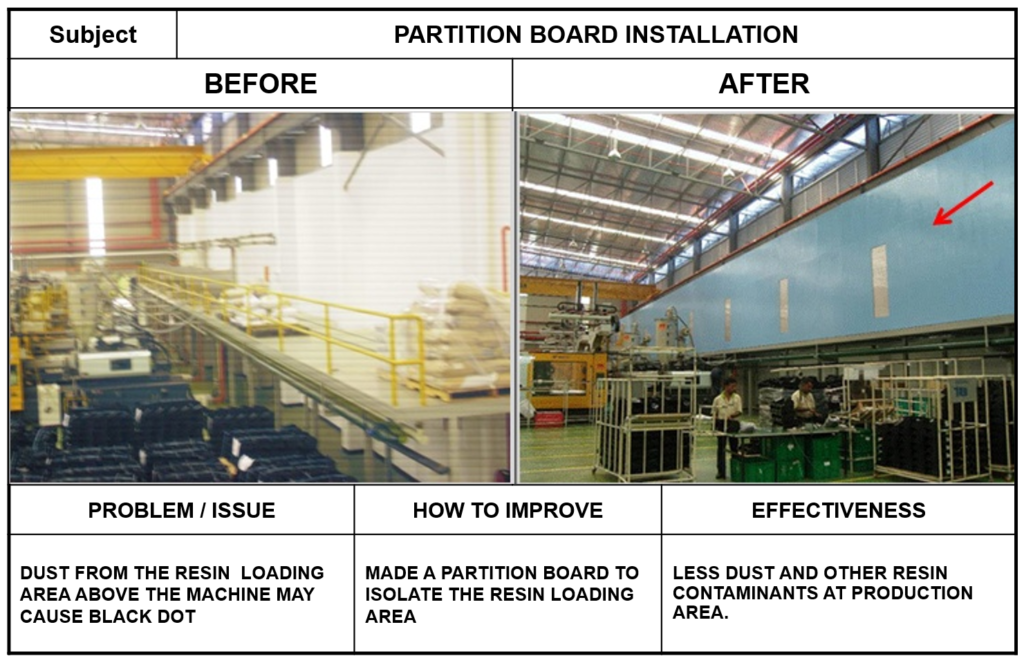
- Resin Loading Partition Boards: The area directly above the injection molding machines, where raw resin bags were transported and loaded into hoppers, generated significant airborne dust. This dust would drift down onto the active machinery and into open ports. The team engineered and installed large Partition Boards to completely isolate the overhead resin loading mezzanine from the production floor. This contained resin dust at the source and prevented cross-contamination.
Countermeasure 3: Transitioning to Closed-Loop Internal Crushing
Regrinding runners and sprues is vital for material efficiency, but outsourcing this process introduced uncontrollable variables:
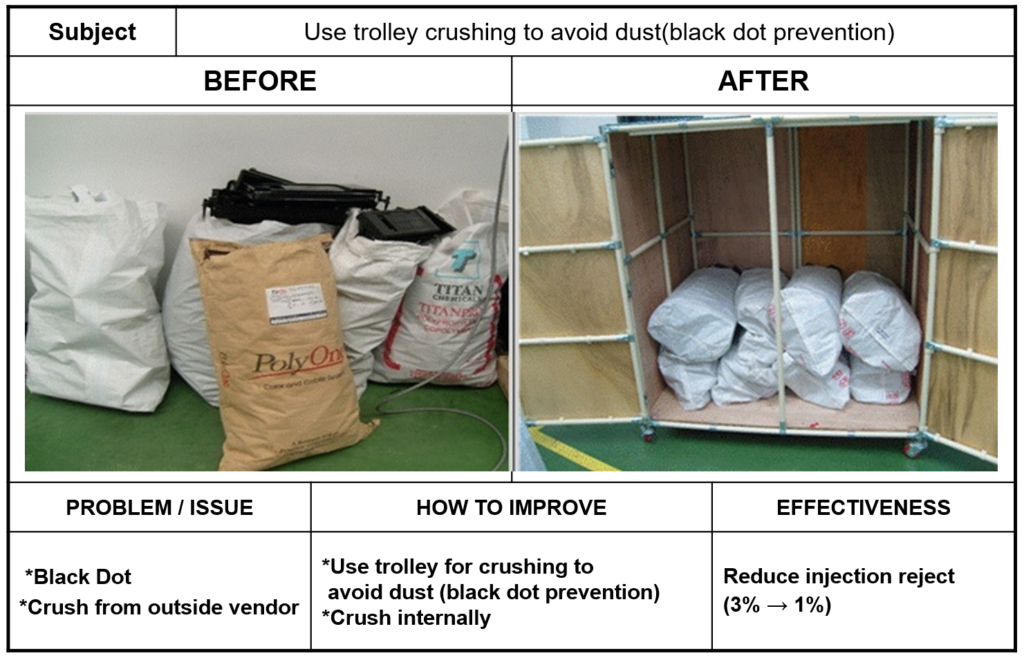
- Before: Material was sent to an external vendor for crushing, returning in bags that were heavily exposed to dust and external pollutants—a major source of embedded black dots.
- After: The team localized the process by implementing internal trolley crushing. By keeping the regrinding process enclosed and fully internal, the team eliminated transit-related pollution and gained full control over cleanliness.
4. Quality improvement : Quantifiable Results and Success Metrics
The true test of any manufacturing optimization project lies in the empirical data gathered post-implementation. The engineering modifications yielded immediate, profound improvements across all target areas.
Radical Reduction in Process Rejections
The specific localized countermeasure actions yielded exceptional reductions in individual reject rates:
- Preheating via Standby Hoppers: Reduced moisture-related injection rejects from 4% down to just 1%.
- Internal Trolley Crushing: Reduced contamination and black dot injection rejects from 3% down to 1%.
The Macro Trend: Assembly Line PPM Reduction
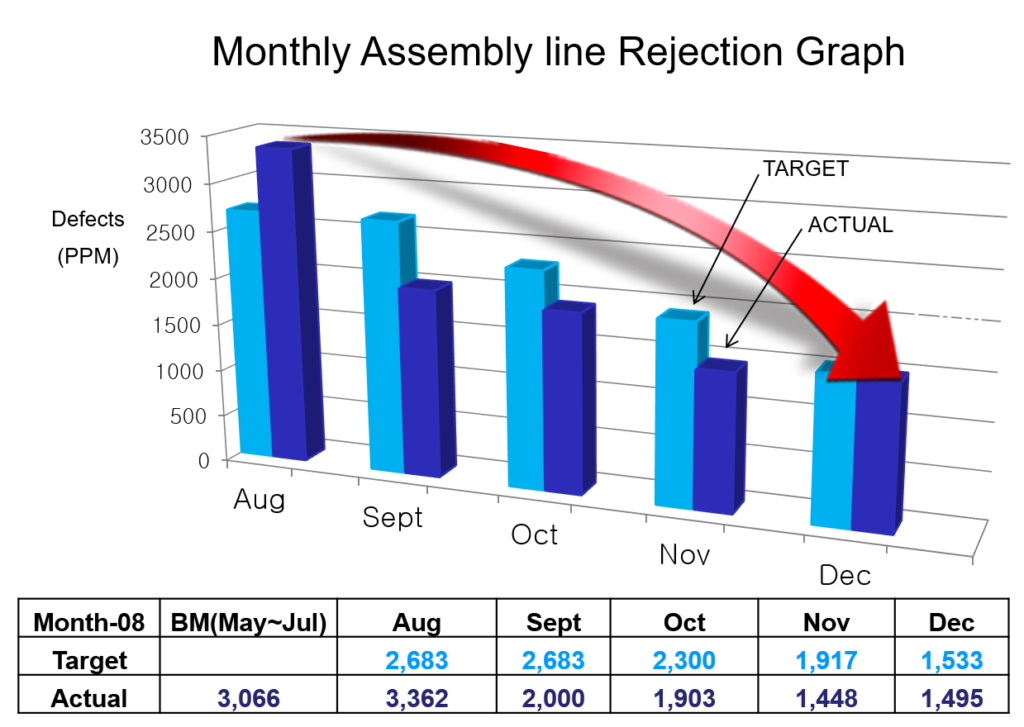
The ultimate validation of the project came from the monthly assembly line rejection graph, which tracked the long-term stabilization of the process from a baseline of 3,066 PPM (May-Jul average):
- August (The Peak): Rejections surged to 3,362 PPM as early-stage changes were being deployed and stabilized.
- September: Following the full implementation of the hopper upgrades and partition barriers, rejections plummeted to 2,000 PPM (beating the target of 2,683 PPM).
- October & November: The process continued to stabilize, dropping to 1,903 PPM and 1,448 PPM respectively.
- December (The Final Count): Rejections closed out at 1,495 PPM, soundly beating the aggressive year-end target of 1,533 PPM. This represented an overall reduction of over 50% in assembly line defects from the initial peak.
Final KPI Evaluation: A Lean Transformation
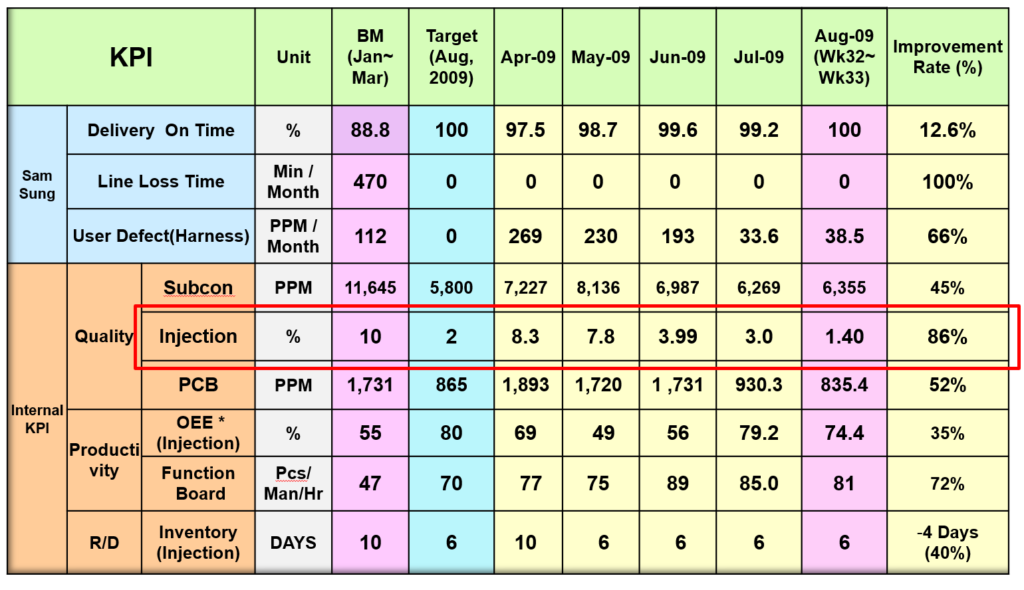
By August 2009 (tracked through Week 32 and 33), the systematic improvements had successfully rippled through the entire operational framework, transforming the initial baseline metrics:
- Delivery On Time (DOT): Hit a perfect 100%, marking a 12.6% improvement rate from the baseline.
- Overall Injection Quality: The aggregate internal quality metric realized a 86% improvement rate, dropping down to a highly controlled operating envelope.
- OEE (Injection): Shot up from 55% to 74.4% (a 35% improvement), driven directly by reduced downtime for mold cleaning and fewer defect-driven line stoppages.
- Productivity: Expanded by 72%, rising from 47 to 81 Pcs/Man/Hr due to smoother material flow and minimized rework cycles.
- Inventory Days: Slashed from 10 days down to 6 days, achieving a 40% improvement in lean capital allocation.
5. Advices for Manufacturing Leaders
This DMAIC case study reinforces a timeless truth in industrial engineering: complex quality issues rarely require convoluted software solutions; instead, they demand rigorous environmental control, disciplined process isolation, and optimized material preparation.
By investing in fundamental improvements—such as secondary preheating hoppers to ensure thorough drying and physical partition enclosures to lock out ambient dust—the organization did not just fix a temporary defect trend. They re-engineered the reliability of their manufacturing ecosystem.
For business leaders and plant managers looking to scale their operations globally, the lesson is clear. True lean transformation occurs when data guides your vision, the Pareto principle focuses your scope, and robust engineering controls lock in your quality gains.
🔗 Recommended Reading:
Mastering Line of Balance (LOB) for Manufacturing Productivity
7 Wastes : The Definitive Guide to Eliminating Non-Value-Adding Activities
Discover more from mfginsights.net
Subscribe to get the latest posts sent to your email.