In today’s highly competitive industrial landscape, maximizing manufacturing efficiency is no longer optional—it is a baseline for survival. For plant managers, industrial engineers, and operations leaders, the ultimate goal is always to achieve higher output with optimized resources.
But how do we scientifically measure, analyze, and improve this flow? The answer lies in two foundational concepts of industrial engineering: Productivity Optimization and Line of Balance (LOB).

1. The Mathematical Foundation of Productivity
To improve anything, you must first be able to measure it. In manufacturing, productivity is governed by a simple yet powerful formula:

Based on this mathematical relationship, there are strictly three strategic levers you can pull to drive productivity upward:
- Increase Production Output: Generate more finished goods using the same baseline of resources.
- Reduce Manpower: Streamline operations so that fewer operators are required to achieve the same output.
- Reduce Working Hours: Eliminate waste and downtime to shorten the time required to complete the production run.
2. Understanding Line of Balance (LOB) and the Bottleneck Trap
Even if you understand the productivity formula, you cannot optimize a multi-stage assembly line by looking at it as a single block. You must analyze the Line of Balance (LOB), which measures how evenly work is distributed across various sequential processes.
The pace of your entire production line is dictated by the slowest operation, known as the Bottleneck. No matter how fast your early stages run, your maximum throughput is capped by the bottleneck’s cycle time.
The Line of Balance (LOB) Calculation Formula
LOB efficiency is calculated by comparing the total workload against a perfectly balanced scenario dictated by the bottleneck:

When the LOB percentage is low, it indicates severe imbalance—meaning while one operator is overworked at the bottleneck, other operators are sitting idle, creating hidden financial waste.
3. Case Study: From Line Imbalance to High Efficiency
Let’s look at a practical industry case study to see how line balancing dramatically transforms operational KPIs.
The Initial State (Before Improvement)
Consider a line with 7 consecutive operations (OP10 to OP70), each staffed by 1 operator (Total Manpower = 7).
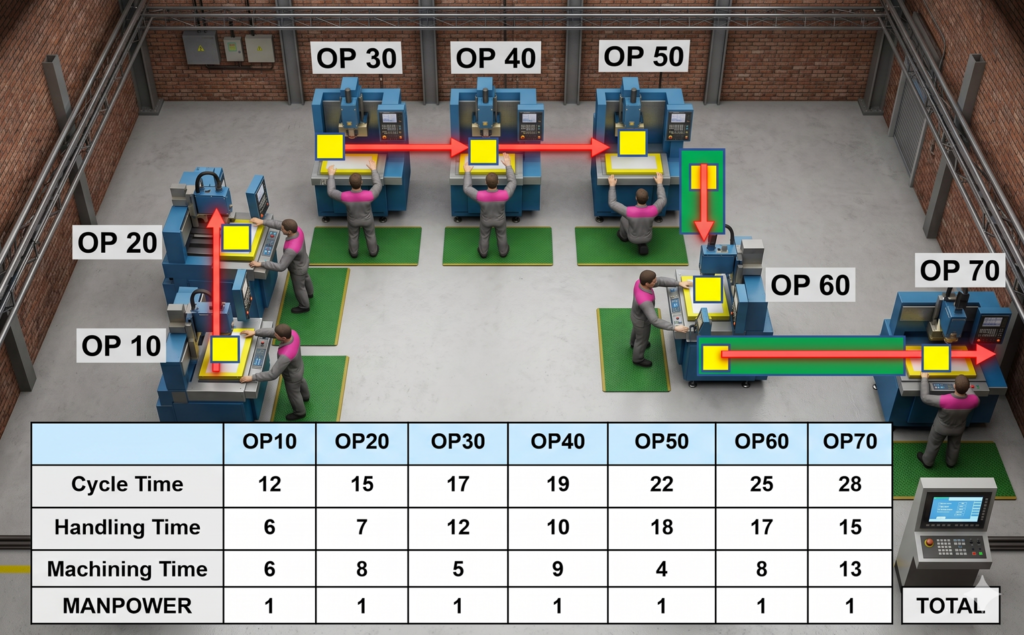
| Process | Work Contents | Handling Time (s) | Machining Time (s) | Total Cycle Time (s) | Manpower |
| OP10 | Initial Setup | 6 | 6 | 12 | 1 |
| OP20 | Cutting / Prep | 7 | 8 | 15 | 1 |
| OP30 | Primary Welding | 12 | 5 | 17 | 1 |
| OP40 | Drilling | 10 | 9 | 19 | 1 |
| OP50 | Secondary Welding | 18 | 4 | 22 | 1 |
| OP60 | Quality Test | 17 | 8 | 25 | 1 |
| OP70 | Packaging (Bottleneck) | 15 | 13 | 28 | 1 |
| TOTAL | 138 | 7 |
- Bottleneck: OP70 with a Cycle Time of 28 seconds.
- Initial SPH (Strokes Per Hour): 3600 seconds /28 seconds = 128.5 Pcs/Hr
- Initial Hourly Productivity: 128.5 Pcs / 7 Men / Hr = 18.35 Pcs/Man/Hr.
- Initial LOB Rate: 138 seconds/ 7 men / 28 seconds X 100% = 70.4%.
At 70.4% LOB, the line suffers from massive idle time in the earlier, faster processes like OP10 and OP20.
The Lean Strategy: Process Consolidation and Bottleneck Reduction
To eliminate this waste, engineers applied two classic lean principles:
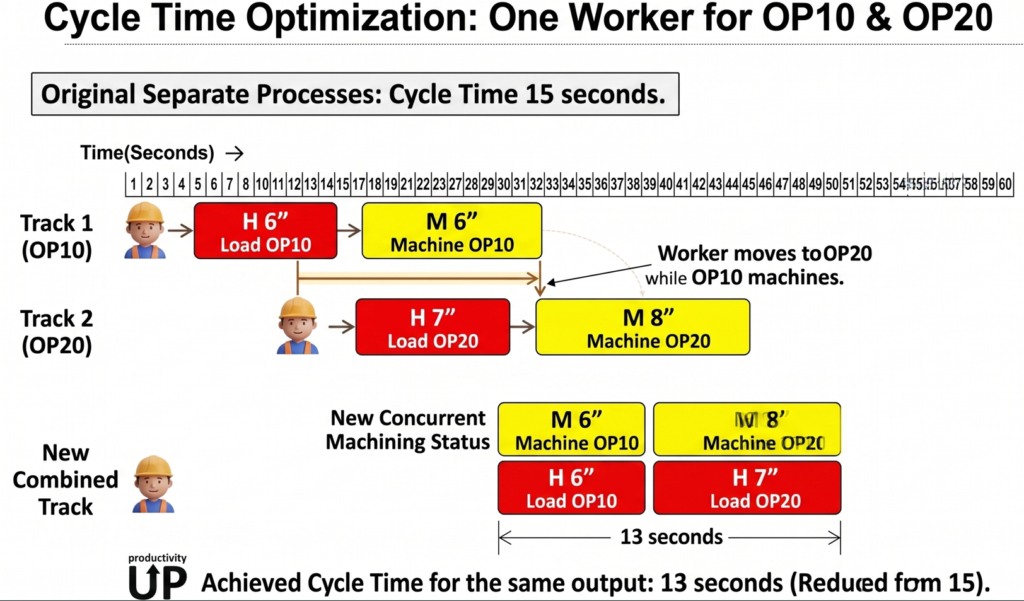
- Process Integration (Manpower Reduction): OP10 and OP20 were combined into a single workstation managed by 1 operator. Similarly, OP30 and OP40 were merged. This slashed total manpower from 7 down to 5.
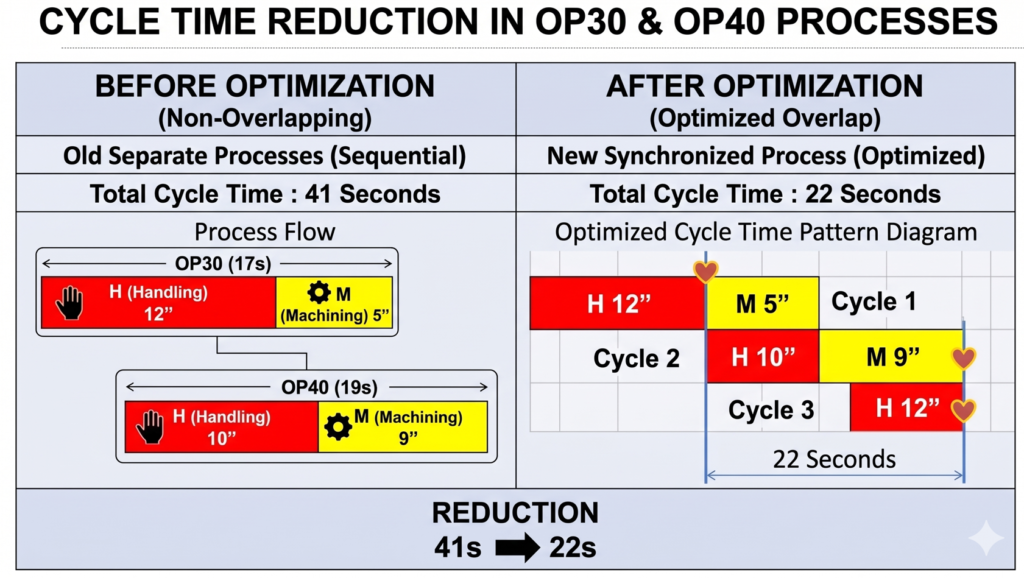
- Cycle Time Optimization: By reallocating tasks and overlapping manual handling with machine run-times, the maximum bottleneck time was compressed from 28 seconds down to 25 seconds.
3. OP70 : Handling time was reduced to 12 seconds (10% reduction) by eliminating the operator’s wasted motions. Let’s look at the improvements achieved through productivity optimization, as detailed in the table below.
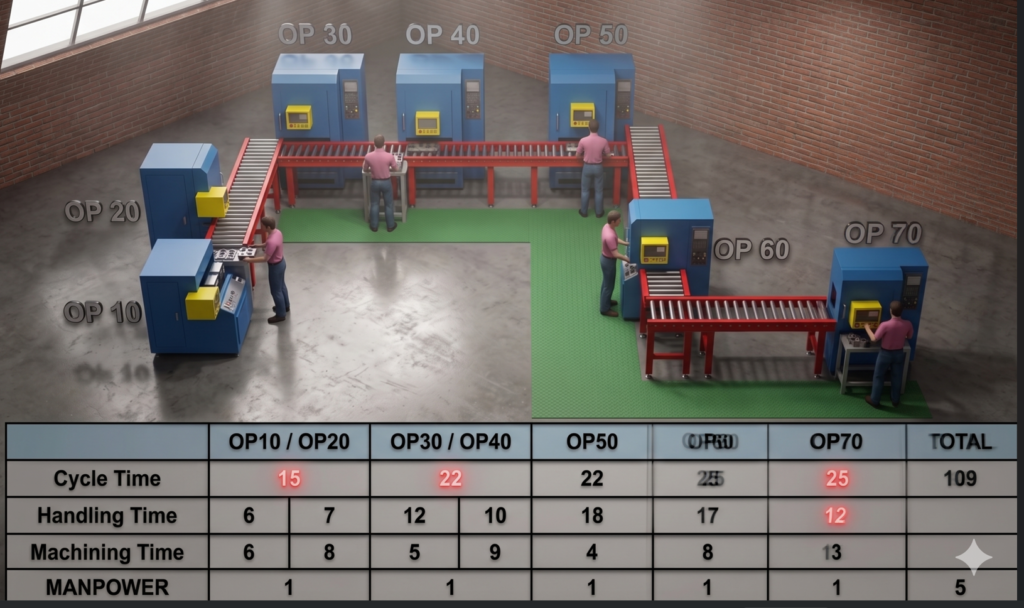
The Improved State (After Lean Implementation)
| Combined Process | Consolidated Components | Optimized Cycle Time (s) | Manpower |
| OP10 / OP20 | Integrated Setup & Prep | 15 | 1 |
| OP30 / OP40 | Integrated Drilling & Weld | 22 | 1 |
| OP50 | Secondary Welding | 22 | 1 |
| OP60 | Quality Test | 25 | 1 |
| OP70 | Packaging | 25 | 1 |
| TOTAL | 109 | 5 |
4. The Results: Compounding ROI
By reducing the bottleneck cycle time and optimizing the headcount, the plant achieved a massive double-win in efficiency:
- Bottleneck: OP70 with a Cycle Time of 25 seconds.
- New Production Output (SPH): 3600 seconds /25 seconds = 144 Pcs/Hr(Up from 128.5).
- New Hourly Productivity: 144 Pcs / 5 Men / Hr = 28.8 Pcs/Man/Hr.
- Line of Balance (LOB) Rate: 109 seconds/ 5 men / 25 seconds X 100% = 87.2%.
Key Takeaway: Through systematic line balancing, Productivity skyrocketed by 57% while the LOB rate improved by 16.8%. The line now runs smoother, faster, and with significantly lower labor costs.
Conclusion
Productivity improvement is not about forcing operators to work faster; it is about working smarter by design. By utilizing Line of Balance (LOB) mapping, you can pinpoint exactly where capacity is being wasted. Shrink your bottleneck cycle times, merge unbalanced operations to optimize manpower, and watch your manufacturing competitiveness soar.
💡 Further Reading & Resources:
For more insights on manufacturing excellence and strategic transformation, read more post below.
Crushing Transportation Waste: Strategic Layout Innovation
Discover more from mfginsights.net
Subscribe to get the latest posts sent to your email.