In today’s highly competitive industrial landscape, maximizing manufacturing efficiency is no longer optional—it is a baseline for survival. To achieve year-over-year operational excellence and meet ambitious Key Performance Indicators (KPIs), manufacturing leaders must look beyond isolated, point-based improvements. Instead, they need a systemic, holistic view of their production environment.
This is where Value Stream Planning (VSP) and its core visual engine, Value Stream Mapping (VSM), become indispensable. Based on proven industrial engineering frameworks, this comprehensive guide provides a structured blueprint to map, analyze, and optimize your plant operations.
Section 1: The Strategic Framework of Value Stream Planning (VSP)
Before picking up a pencil, it is vital to understand the broader ecosystem in which a Value Stream Mapping (VSM) project operates. Value Stream Planning (VSP) is a strategic, system-wide methodology designed to analyze current manufacturing operations, pinpoint operational constraints, identify areas of concern, and execute a structured plan to eliminate waste.
The Dual Pillars of VSP
A successful VSP framework balances two distinct states of execution:
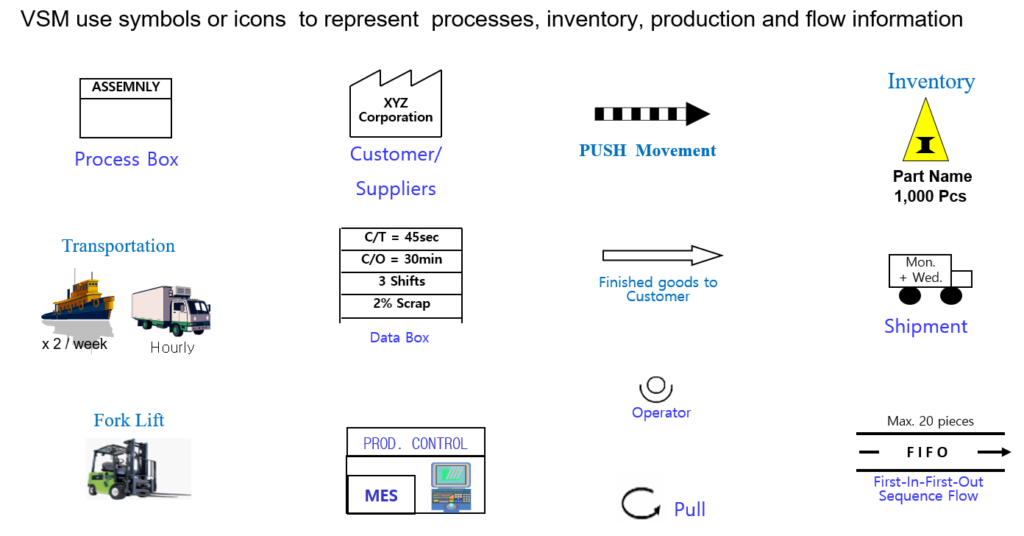
- Value Stream Map (VSM): A granular, visual representation of the current state of operations, documenting exactly how products and information flow today.
- Value Stream Design (VSD): A blueprint of the future state—the idealized flow that the plant aims to achieve within a 1-to-3-year horizon after removing non-value-added wastes.
Defining Operational “Value”
To map a value stream effectively, teams must align on how the end customer defines value:
- Value-Add (VA): Any physical conversion or process that directly transforms the shape, form, or function of materials to meet explicit customer requirements.
- Non-Value-Add (NVA / Waste): Activities that consume time, space, or resources and add cost to the product without adding any true value from the customer’s perspective.
- Incidental Work: Necessary non-value-adding tasks that must be performed under current operational constraints (e.g., equipment setups, safety checks) but should be minimized over time.
Section 2: The Tactical Roadmap — 8 Steps to Drawing a Current-State Value Stream Mapping
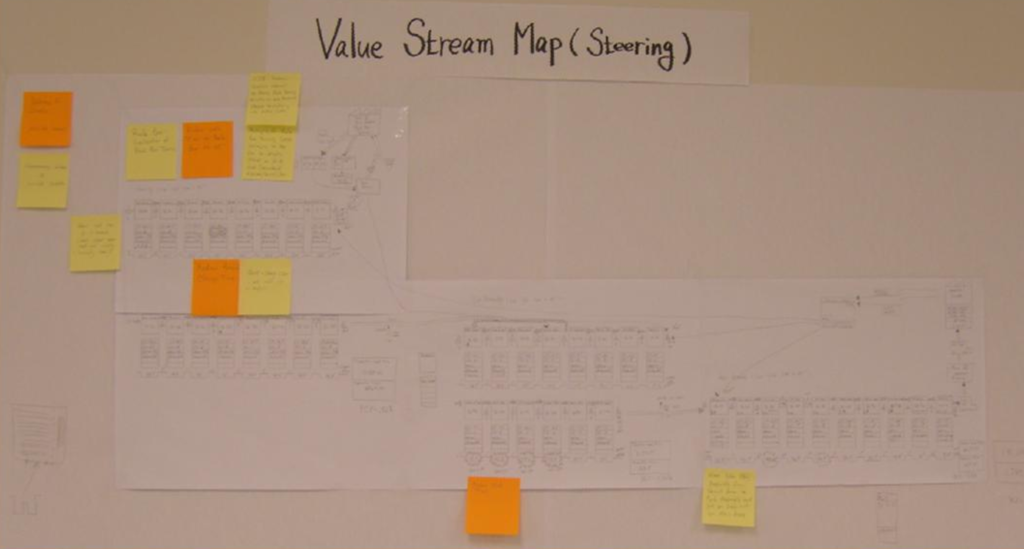
Drawing a VSM requires a disciplined, step-by-step approach. Lean practitioners strongly advise using a pencil and paper directly on the shop floor (a “Gemba” walk) to count actual parts and verify actual times rather than relying strictly on computerized database reports.
Below is the structured 9-step execution sequence to build an accurate Current-State VSM:
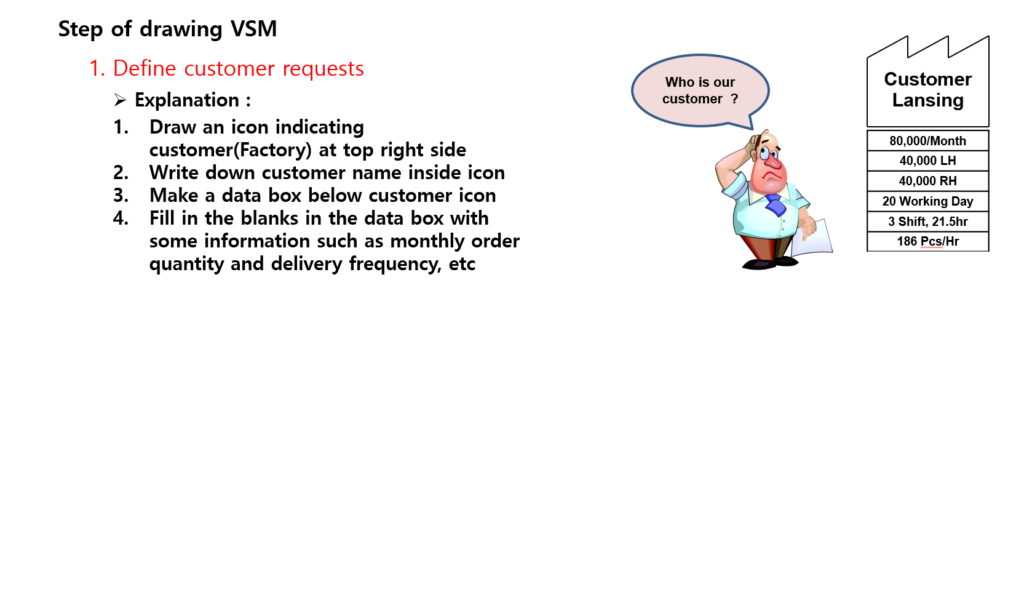
Step 1: Define Customer Requirements
Begin your mapping layout at the top right-hand corner of the page. Draw the customer icon, label it clearly with the customer or destination factory name, and attach a data box detailing monthly order volumes, container sizes, daily requirements, working shifts, and the calculated operating hours.
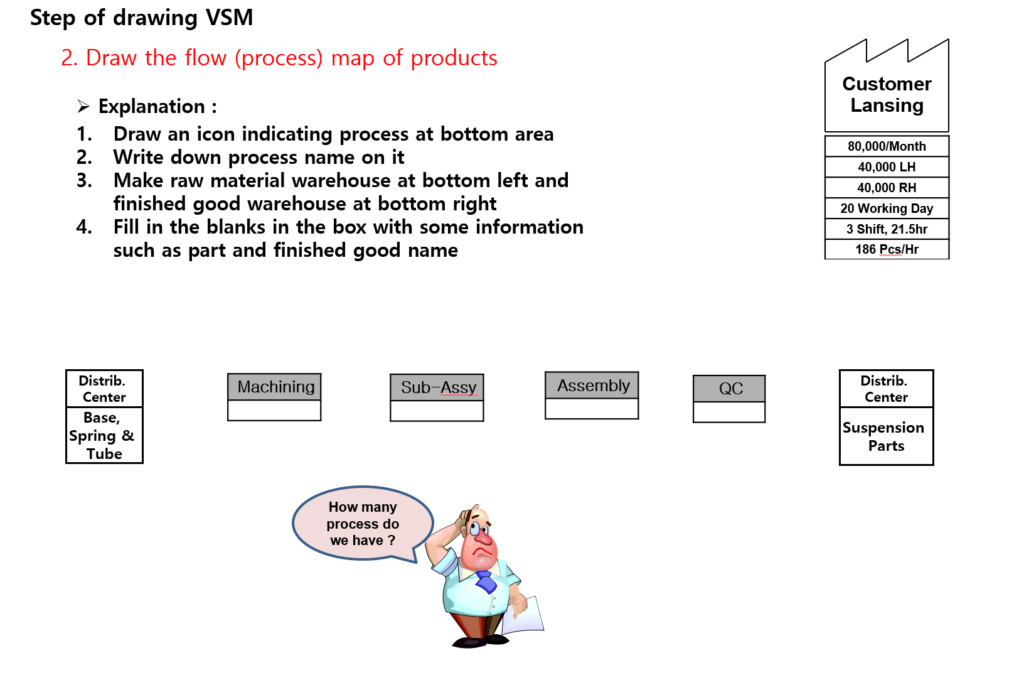
Step 2: Draw the Product Process Flow Architecture
Lay out the primary manufacturing stations sequentially along the bottom row of the diagram from left to right. Map out where the raw material warehouse or incoming distribution dock sits (bottom left) and where the finished goods shipping buffer resides (bottom right).
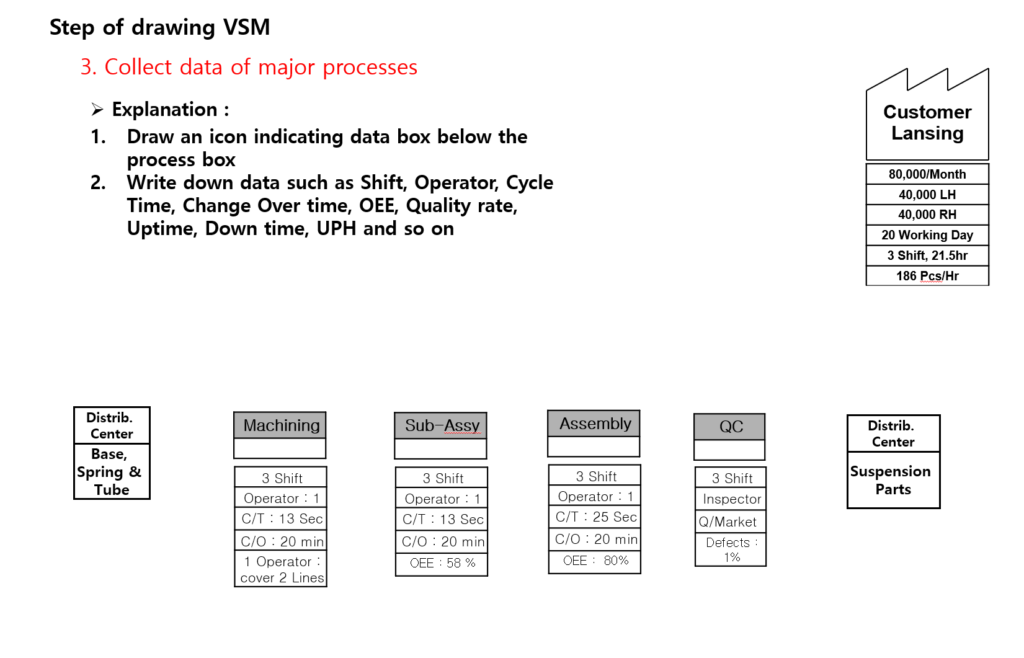
Step 3: Collect and Document Major Process Data
Directly underneath each process box, attach a standardized Data Box. Conduct floor observations to record live operating parameters, including:
- Cycle Time (C/T): The time elapsed between completing consecutive parts.
- Changeover Time (C/O): The duration required to switch a machine from making one product variant to another.
- Overall Equipment Effectiveness (OEE) and planned/unplanned downtime rates.
- Crew size (Manpower), shift configurations, and historical first-pass quality yield rates.
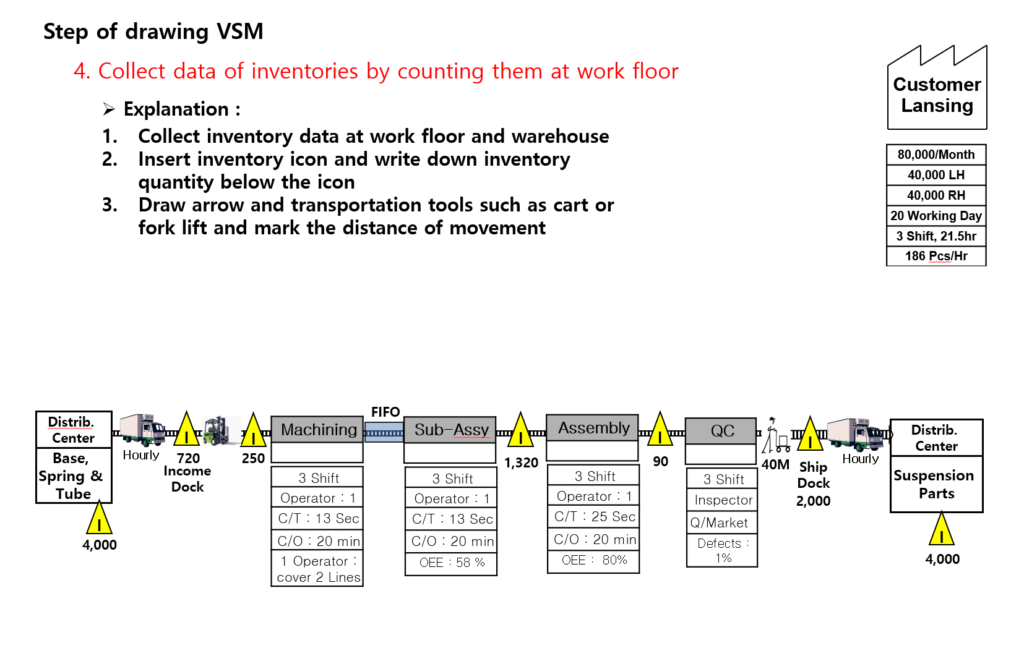
Step 4: Map and Count Real-Floor Inventories
Never guess inventory numbers from an ERP dashboard. Walk the floor to physically count raw material batches, work-in-progress (WIP) sitting between stations, and finished goods waiting to be loaded. Use warning triangles to mark these staging areas on the map and write down the exact quantities below them.
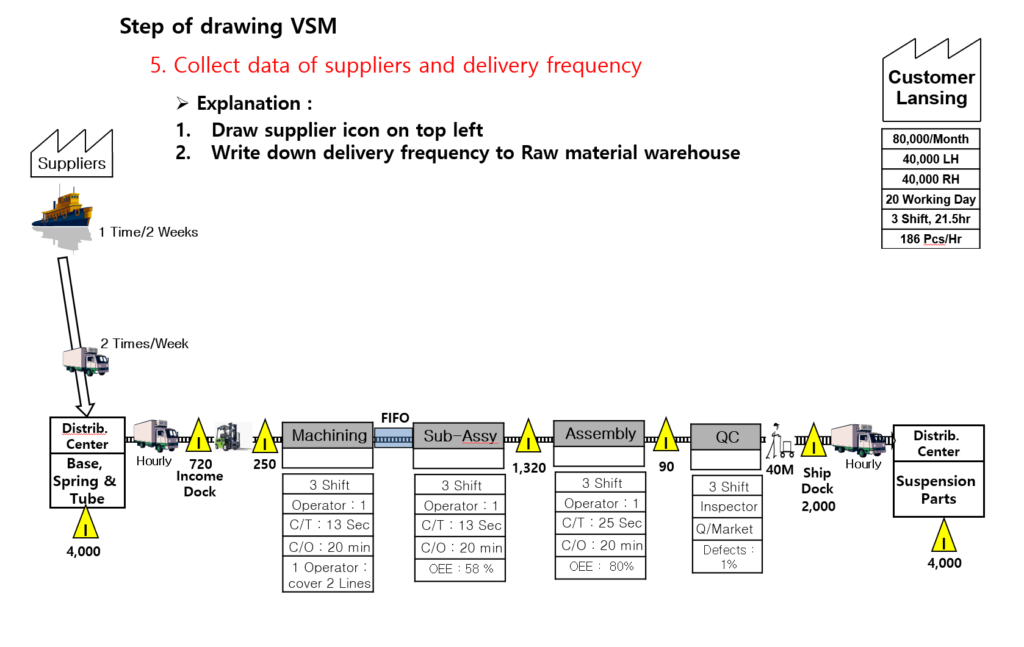
Step 5: Map Supplier Logistics and Delivery Frequencies
Place the supplier icon at the top left corner of your diagram. Draw transportation lines connecting them to your raw materials dock, explicitly detailing how often materials arrive (e.g., twice weekly via truck, bi-weekly via container ship).
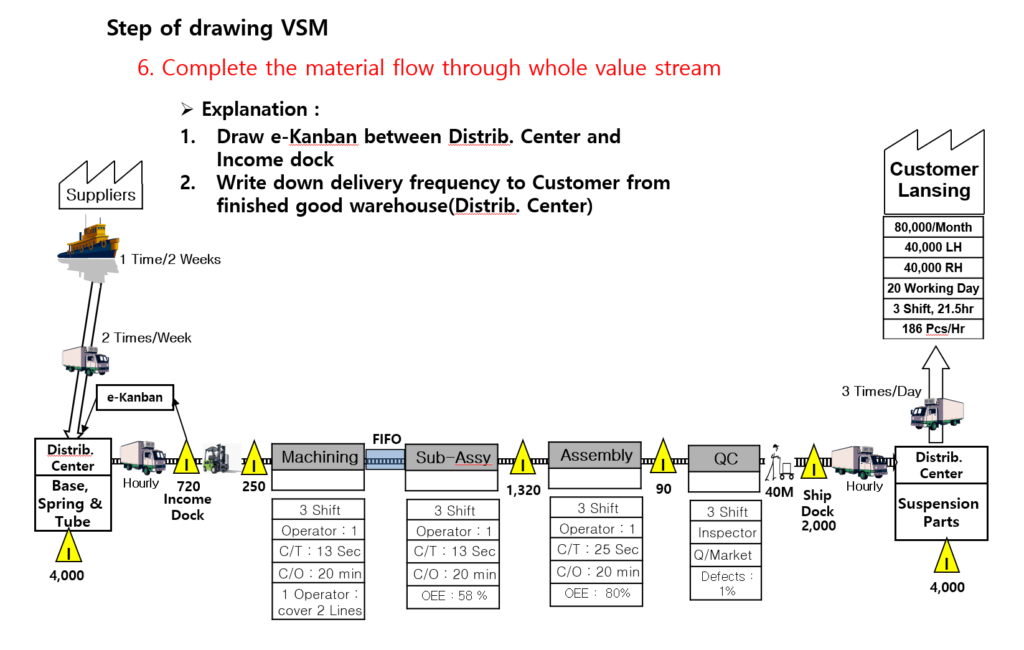
Step 6: Connect the End-to-End Material Flow
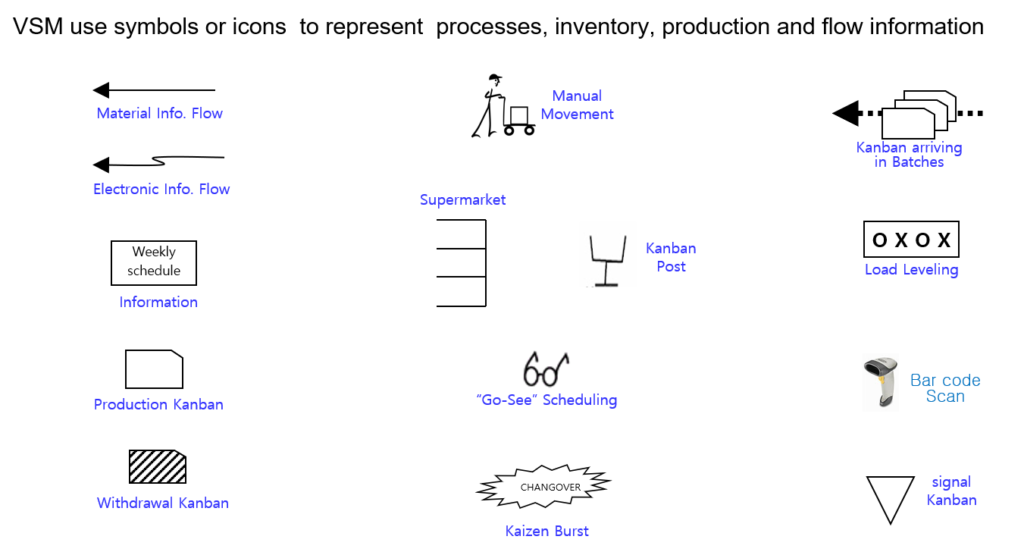
Draw material flow indicators between your processes. Differentiate whether your production lines rely on uncontrolled Push Movements (where parts are forced to the next station regardless of readiness) or organized Pull Systems (such as standard First-In-First-Out [FIFO] lanes or Kanban-controlled supermarkets).
Step 7: Layer the Information Flow
Value streams are driven by information. Draw the Production Control department icon in the center-top area of your map. Use straight lines to show manual information channels (like weekly schedules or printed orders) and lightning-bolt lines to indicate electronic information flow (such as e-Kanban signals, EDI forecasts, or MES dispatches).

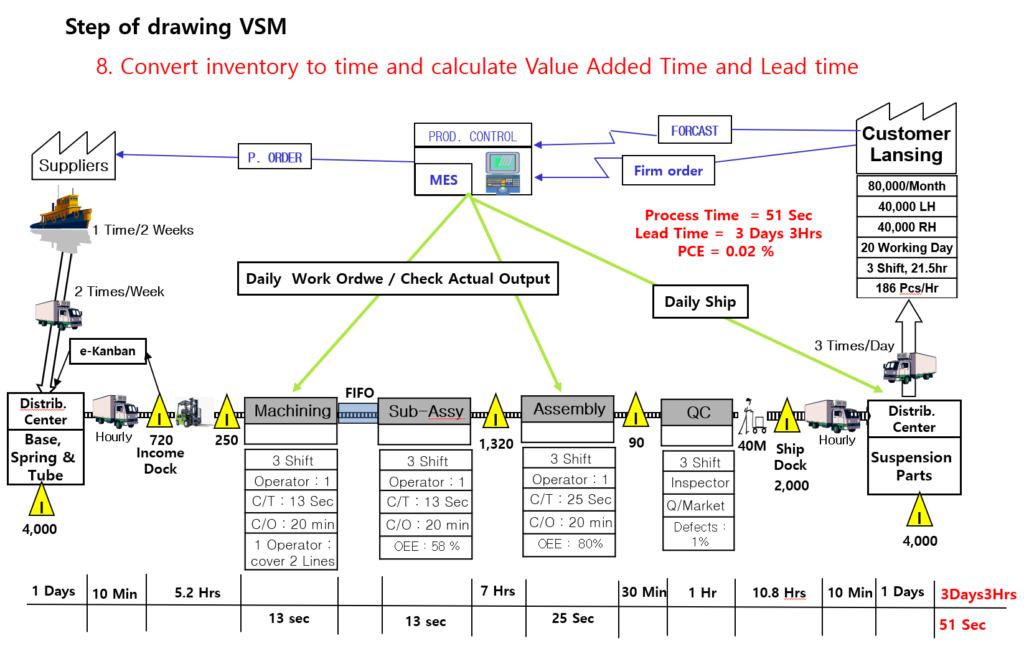
Step 8: Convert Physical Inventory into Time Buffers and Calculate Performance Metrics
To gauge process flow speed, convert physical inventory counts into time units based on daily customer demand.
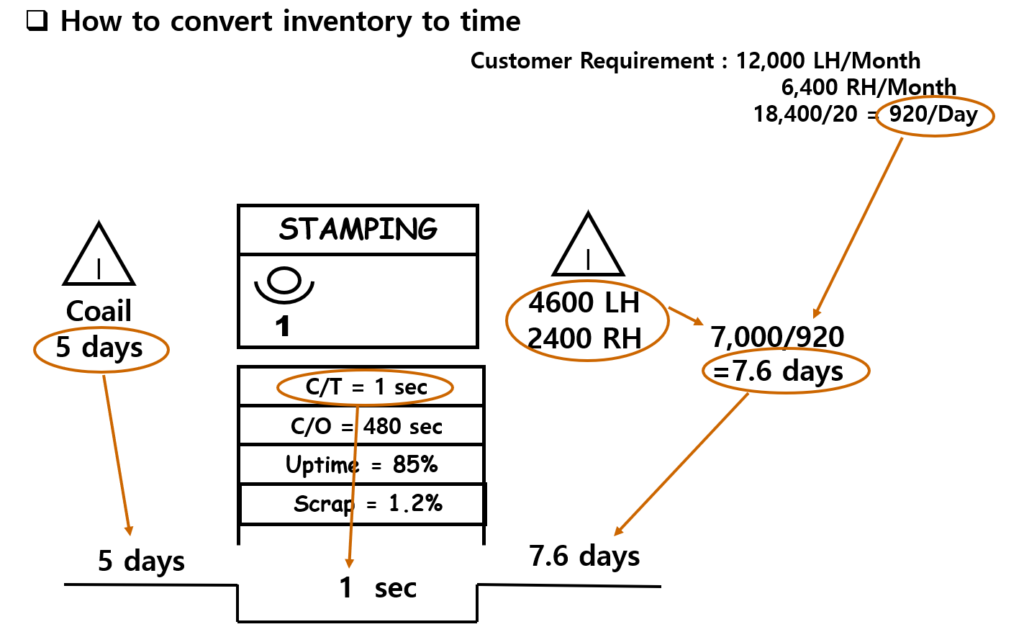
Draw a staggered timeline rail along the very bottom of the map. Place the non-value-added inventory lead times on the raised steps and the value-added process cycle times on the lower troughs. Sum these values to determine your total Production Lead Time (PLT) versus total Value-Add Time (VAT), and finalize the map by calculating your overall Process Cycle Efficiency (PCE).
Section 3: Diagnostic Analysis — Spotting the 7 Manufacturing Wastes
Once your Current-State VSM is finalized, it serves as a visual diagnostic tool to expose hidden waste and inefficiencies. Lean practitioners use the map to audit operations against the 7 Classic Production Wastes:
| Waste Category | Visual VSM Indicators & Red Flags | Industrial Engineering Impact |
| 1. Overproduction | Large WIP accumulations; massive gaps between internal supply and real-time customer demand. | Explodes carrying costs, creates massive bottlenecks, and masks underlying quality defects. |
| 2. Inventory | Warning triangles stacked with weeks of supply; extensive safety stock buffers. | Ties up valuable working capital and consumes physical floor space. |
| 3. Waiting | Massive imbalances in Line of Balance (LOB) charts; idle time noted in data boxes. | Disrupts smooth flow; operators wait idle for parts, tools, or machine cycles to clear. |
| 4. Motion | High station handling times compared to actual machine processing times. | Errant walking, reaching, or bending that strains operators without altering the part. |
| 5. Transportation | Long distance arrows and complex logistics tracks across the layout. | Unnecessary moving of parts between warehouses or remote manufacturing zones. |
| 6. Over-processing | Redundant QA gates; manually repeating tasks that add no value. | Performing extra finishing steps or tighter tolerances than what the customer requested. |
| 7. Defects | Data boxes showing low quality rates or high rework percentages. | Wastes raw materials, triggers expensive line reworks, and threatens delivery schedules. |
Section 4: Data-Driven Optimization Metrics
An effective VSM uses concrete performance metrics to drive your continuous improvement program (CIP). When evaluating a completed map, focus heavily on these three foundational mathematical metrics:
1. Takt Time (The Customer’s Heartbeat)
Takt time represents the maximum allowable pace of production required to precisely match the rate of customer demand. Your internal station cycle times must stay below this value to prevent shipping delays.

2. Line of Balance (LOB) Rate
Calculating your Line of Balance consistency allows engineering teams to identify severe station-to-station work imbalances, target structural bottlenecks, and smooth out work distribution across operators to optimize total manpower.
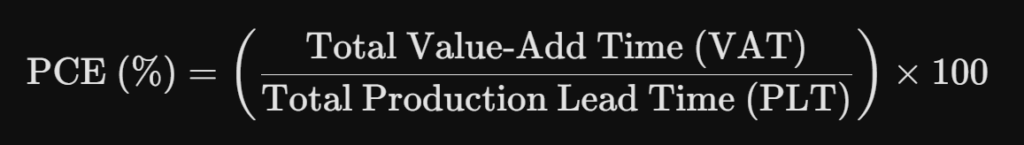
3. Process Cycle Efficiency (PCE)
PCE measures the true velocity of your value stream. In traditional push-based manufacturing, PCE is frequently below $5\%$, meaning materials spend over $95\%$ of their lifecycle sitting idle as stagnant waste.
Conclusion: Moving from Map to Action
A Value Stream Map is not merely a static drafting exercise; it is an active blueprint for systematic plant optimization. By standardizing current operational metrics at the start of each year, operations teams can target point-source wastes, balance line cycle times, and design a streamlined future-state flow.
Use this guide as a training baseline for your teams, get onto the shop floor, and start turning visual data into real-world factory floorspace efficiency.
Feel free to bookmark this post for your next continuous improvement workshop. For questions regarding Takt Time calculations or specific VSM symbology, leave a comment below!
Recommended Reading:
ASQ Official Guide: Plan-Do-Check-Act (PDCA) Cycle
Discover more from mfginsights.net
Subscribe to get the latest posts sent to your email.